Products
SentimenTrader Trading Tools
‍
Backtest Engine
My Trading Toolkit
Correlation Analysis
Seasonality
Indicators & Data API
‍
Proprietary Indicators & Charts
Market Data API
Strategies & Scanner
‍
50+ Trading Strategies
Smart Stock Scanner
Research Reports
‍
Research Solutions
Reports Library
Free Resources
Simple Backtest Calculator
Simple Seasonality Calculator
The Kelly Criterion Calculator
Sentiment Geo Map
Public Research Reports
Education
Sentiment Indicators
Technical Indicators
Pricing
Company
About
In the News
Testimonials
Client Success Stories
Contact
Log inLoginSign up
< BACK TO ALL REPORTS

Medium-Term Risk Levels reached a meaningful threshold...

Jay Kaeppel
2022-03-01
There are many viable risk factors currently hanging over the stock market. Nevertheless, a steady stream of objective indicators flashed favorable signals during the turmoil of January and February, suggesting that investors' fears may be overdone. Our Medium-Term Risk Levels indicator offers a case in point.

Key Points

  • Medium Term Risk Levels (for stocks) recently hit it's lowest level for the second time in the past month
  • While the sample size is small, market performance following previous signals suggests the potential for a market rebound in the near-term

Medium-Term Risk Levels

The chart below displays all days when Medium-Term Risk Levels drops from 2 or higher down to 1. You can run this test in the Backtest Engine.

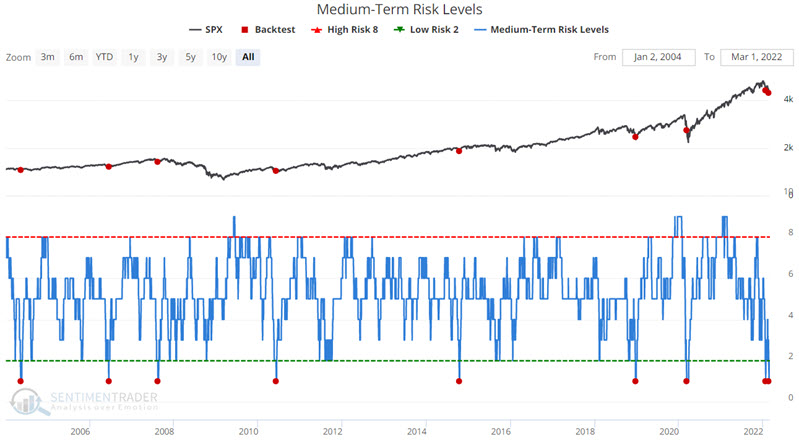
Medium-Term Risk Levels dropped to a reading of 1 on 1/24 and 2/22. Does this matter? Let's consider previous market performance.

The table below displays a summary of the results.

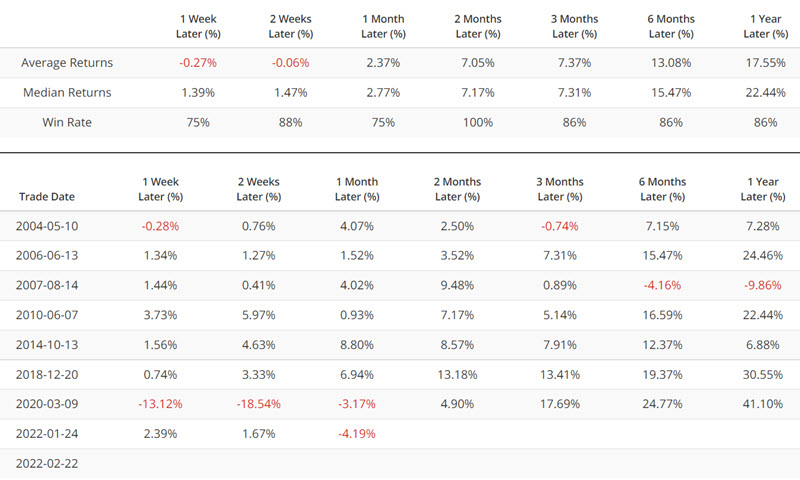
The good news is the consistently high Win Rate across all time periods - particularly two months - and the steadily increasing Average % Return across each time frame.

Another perspective on performance

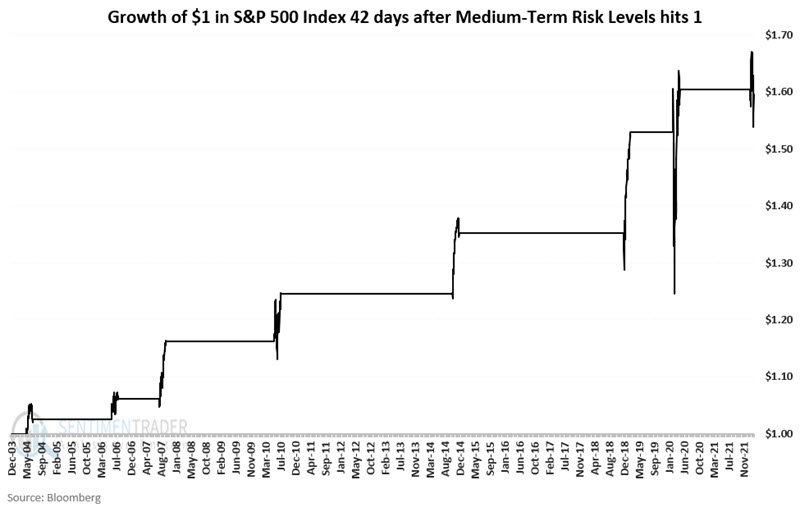
Let's consider the following approach to using these signals:

  • Each time Medium-Term Risk Levels drops from above one to one, we will hold the S&P 500 Index for 42 trading days (2 months x roughly 21 trading days per month)
  • If a new signal occurs while an existing signal is active, the holding period is extended for another 42 trading days
  • So, if only one signal occurs, the holding period will be 42 trading days (i.e., roughly two months). If there are overlapping signals, the holding period will be longer.  

The chart below displays the hypothetical growth of $1 invested in the S&P 500 Index only as described above.

What the research tells us…

Anytime the major market averages all drop below their respective long-term moving averages, there is the risk of a larger bear market overhanging the market. Such is the case today. The risk can be even higher when we can identify specific negative factors such as high inflation, rising interest rates, and war. So, investors should still retain a heavy focus on risk management.

That said, the purpose of following objective sentiment indicators is specifically to highlight when investor fear has become overdone and that the market may be due for an unexpected respite at the very least. The recent action of our Medium-Term Risk Levels indicators argues that this could be one of those times.

PRODUCTS
SentimenTrader
Trading Tools
Indicators & Data API
‍
Strategies & Scanner
‍
Research Reports
FREE
RESOUrCES
Simple Backtest
Calculator
Simple Seasonality
Calculator
The Kelly Criterion
Calculator
Sentiment Geo Map
‍
Public Research Reports
‍
Education
Sentiment Indicators
‍
Technical Indicators
‍
Pricing
Bundle pricing
‍
FAQ
‍
Announcements
‍
COMPANY
‍
About
‍
In the News
‍
Testimonials
‍
Client Success Stories
CONTACT
‍
General Inquiries
‍
Media Inquiries
‍
Financial Professionals Inquiries
‍
© 2025 Sundial Capital Research Inc. All rights reserved.
Setsail Marketing
TermsPrivacyAffiliate Program
Risk Disclosure: Futures and forex trading contains substantial risk and is not for every investor. An investor could potentially lose all or more than the initial investment. Risk capital is money that can be lost without jeopardizing ones’ financial security or life style. Only risk capital should be used for trading and only those with sufficient risk capital should consider trading. Past performance is not necessarily indicative of future results.

Hypothetical Performance Disclosure: Hypothetical performance results have many inherent limitations, some of which are described below. No representation is being made that any account will or is likely to achieve profits or losses similar to those shown; in fact, there are frequently sharp differences between hypothetical performance results and the actual results subsequently achieved by any particular trading program. One of the limitations of hypothetical performance results is that they are generally prepared with the benefit of hindsight. In addition, hypothetical trading does not involve financial risk, and no hypothetical trading record can completely account for the impact of financial risk of actual trading. for example, the ability to withstand losses or to adhere to a particular trading program in spite of trading losses are material points which can also adversely affect actual trading results. There are numerous other factors related to the markets in general or to the implementation of any specific trading program which cannot be fully accounted for in the preparation of hypothetical performance results and all which can adversely affect trading results.

Testimonial Disclosure: Testimonials appearing on this website may not be representative of other clients or customers and is not a guarantee of future performance or success.