
Maybe Dr. Copper is not so smart after all

Key points:
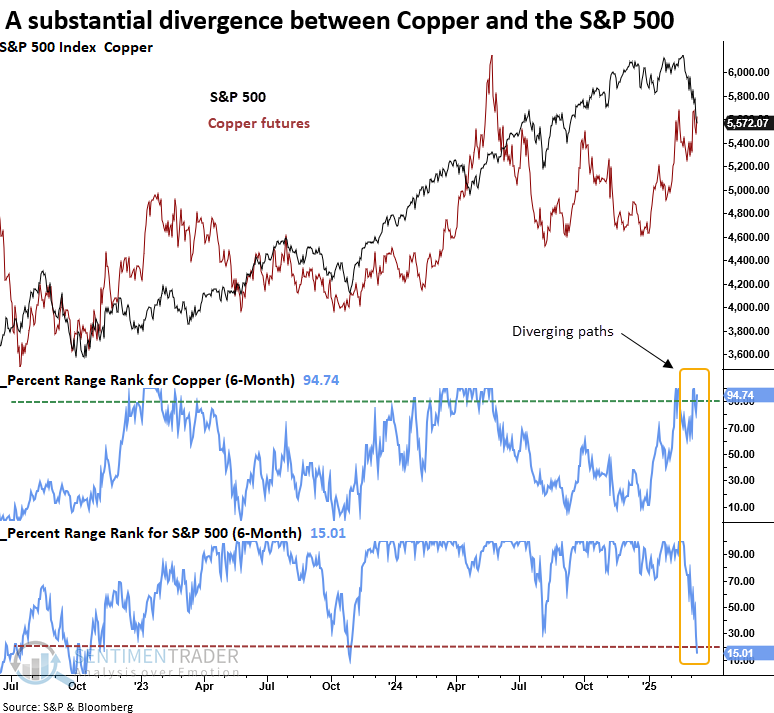
- Copper closed near a 6-month high, while the S&P 500 hovers around a 6-month low
- After similar divergences, the S&P 500 declined 65% of the time over the following three months
- Following comparable precedents, Copper dropped 65% of the time over the ensuing six months
Copper and the S&P 500 are out of sync. Should we trust the market message from stocks or the metal with a PhD in economics?
As I scanned my quotes page yesterday afternoon, watching the S&P 500 slide toward its first 10% correction since 2023, I couldn't help but notice copper pushing higher, hitting yet another six-month high. It seemed counterintuitive that copper, often viewed as an economic bellwether, was rising near six-month highs while stocks were in freefall due to growth concerns.
While copper's strength may be tied to Chinese stimulus or the possibility of U.S. tariffs on copper imports, a more objective approach is to analyze how stocks and copper have responded to similar divergences in the past, avoiding narratives.
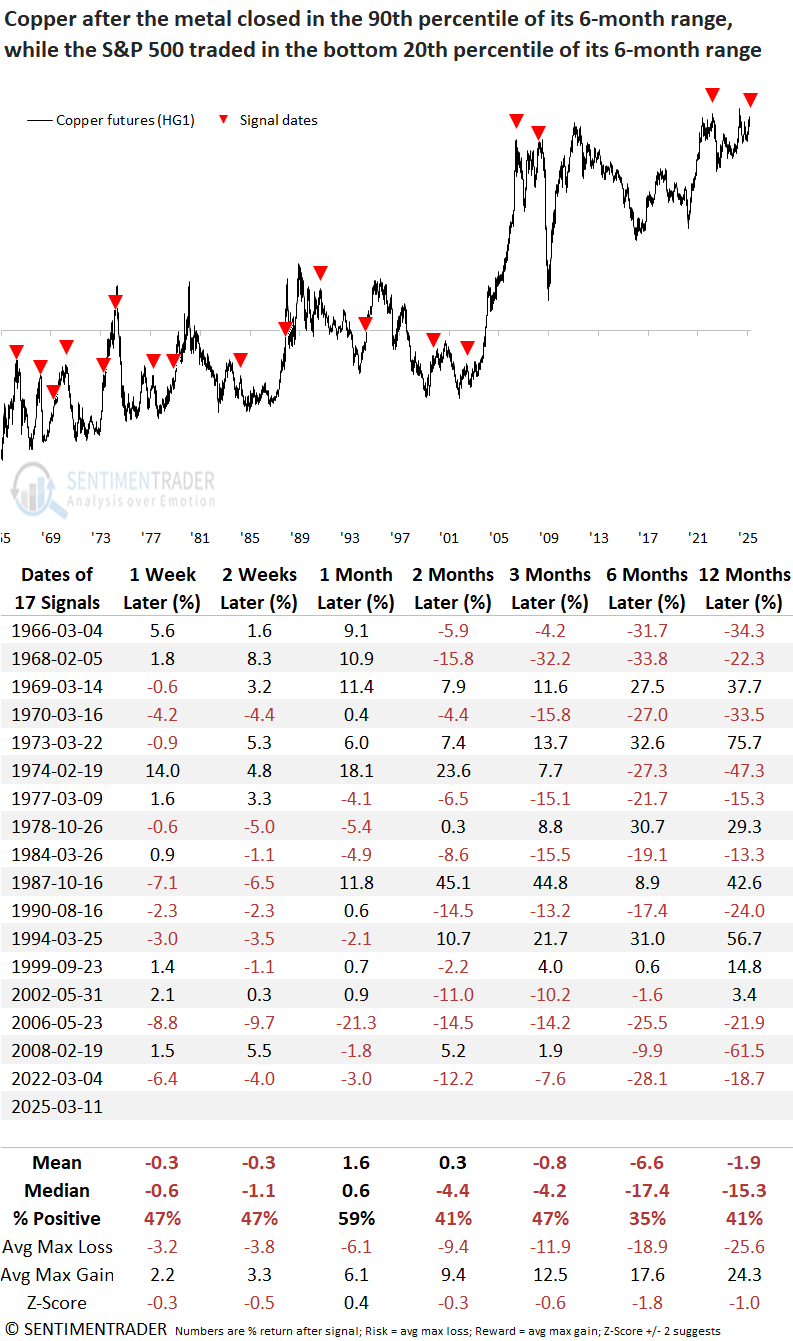
To evaluate the disconnect, I'll apply a 6-month range rank to copper and the S&P 500 to identify cases where copper closed in the 90th percentile or higher while the S&P 500 traded in the 20th percentile or lower, conditions similar to the current setup.
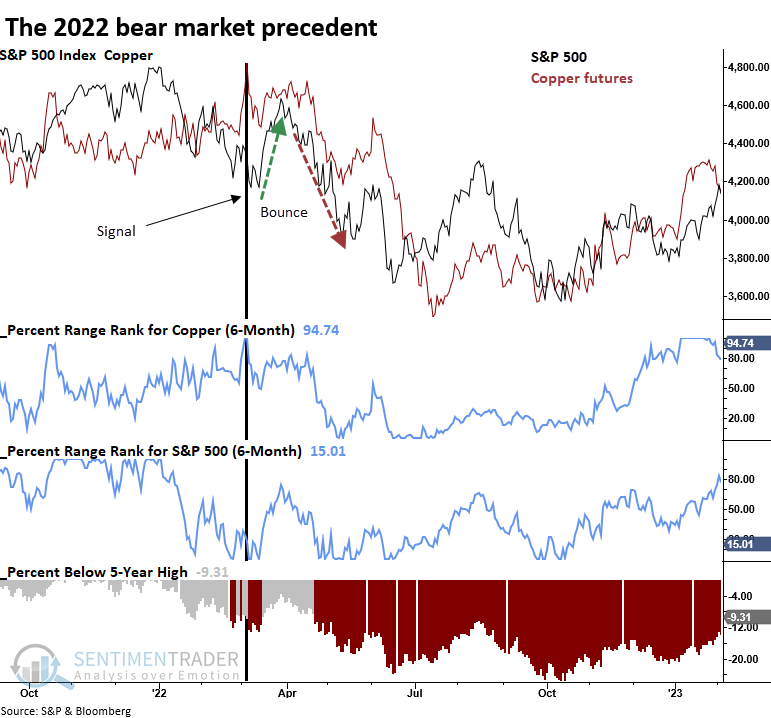
The previous divergence between these two assets appeared in March 2022, during the early stages of the 2022 bear market decline. Intriguingly, that instance preceded a short-term low that led to an 11% S&P 500 rally before the market eventually gave way to lower lows.
When the Copper/S&P 500 divergence emerged in March 2022, the S&P 500 had already declined by 10%. Within two days of that signal, the world's most benchmarked index found a bottom and rallied 11%. Could history rhyme?
Similar divergences produced an unfavorable outlook for the S&P 500
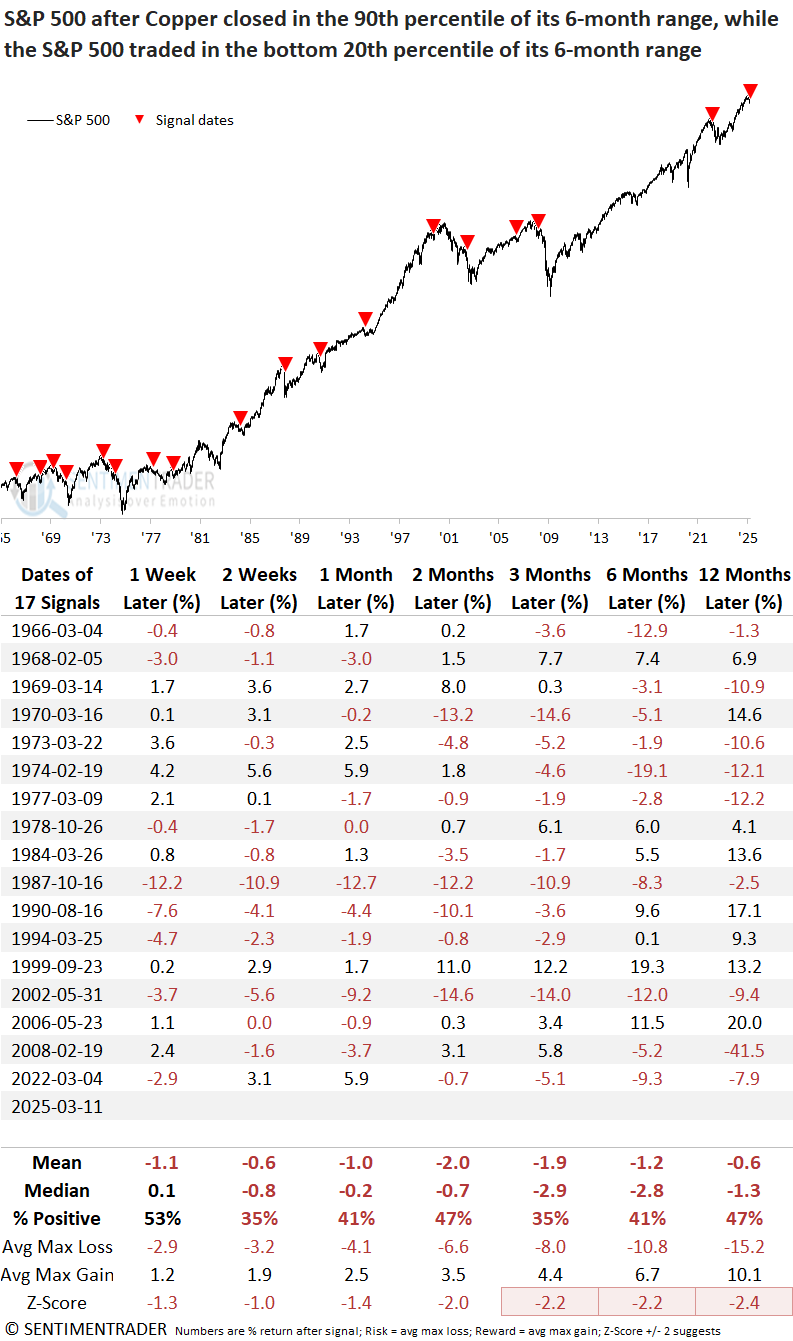
Whenever copper closed in the 90th percentile of its 6-month range while the S&P 500 traded in the bottom 20th percentile of its respective range, the S&P 500 displayed unfavorable returns and win rates over the following year. Additionally, the average maximum loss exceeded the maximum gain across every time frame and several instances coincided with significant stock market peaks.
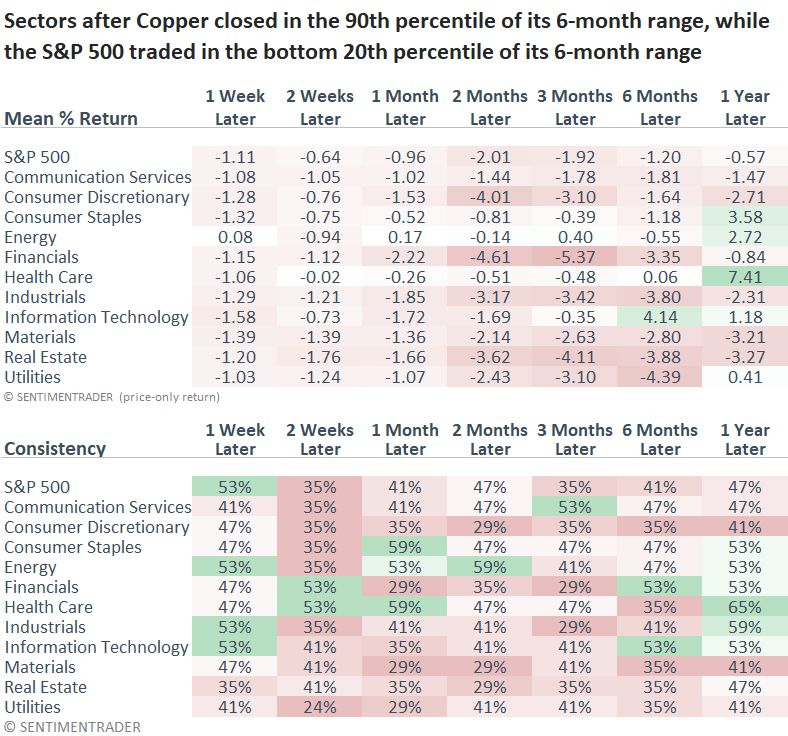
As anticipated, defensive sectors like consumer staples and health care outperformed. However, Utilities didn't follow suit over the next six months.
What about Copper?
Copper's outlook was similarly weak, delivering unfavorable win rates and returns across most time frames. As with the S&P 500, the balance of risk versus reward remained unfavorable at every horizon.
Does a 10% correction foreshadow a bounce?
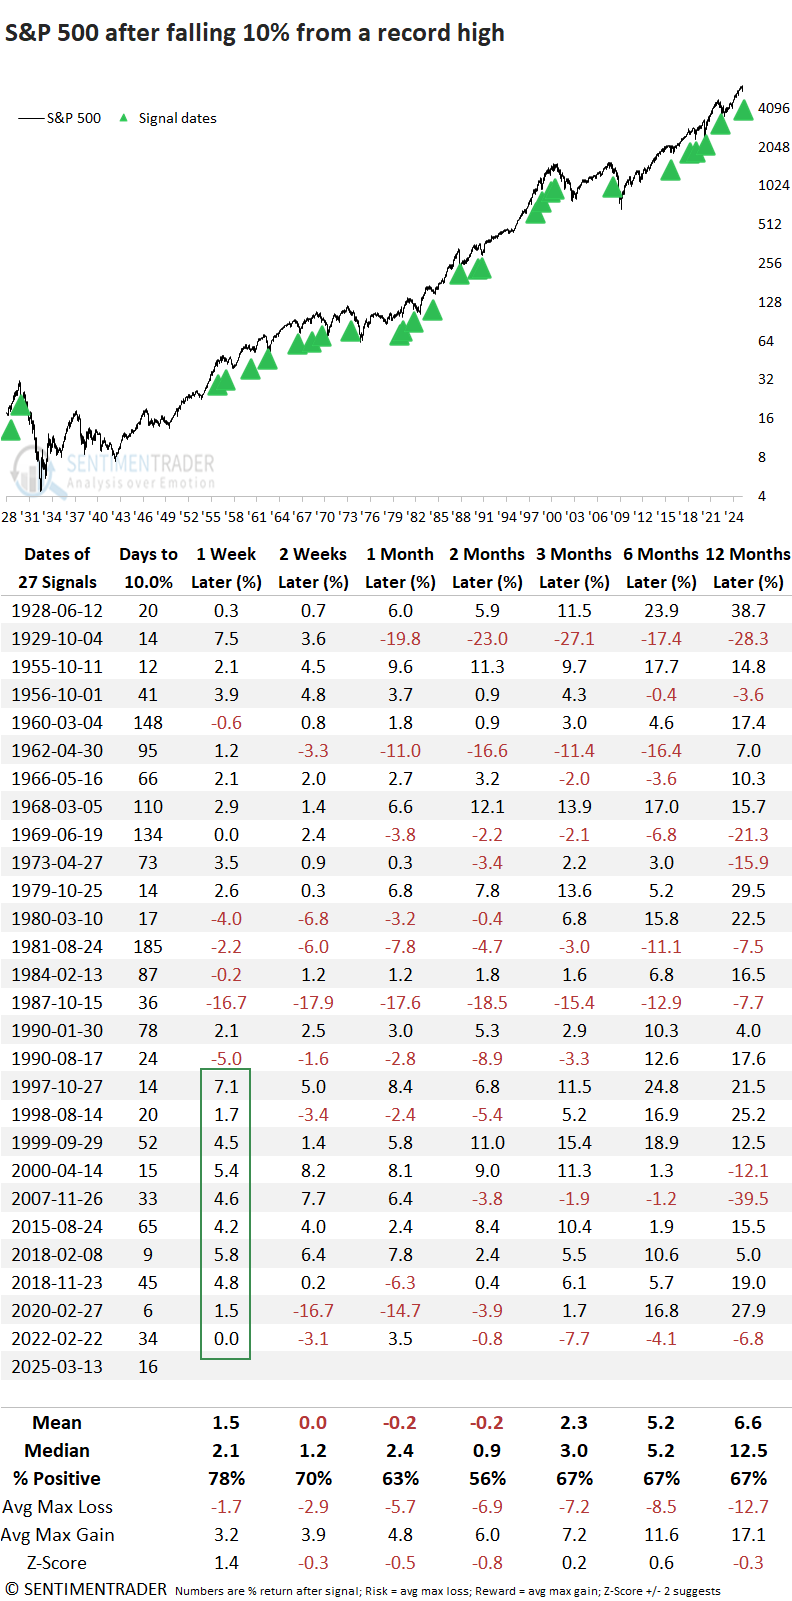
Given that the last Copper/S&P 500 divergence coincided with a 10% correction in the S&P 500 and a subsequent relief rally, let's assess the historical record of all 10% declines from an all-time high.
A 10% correction in the S&P 500 from an all-time high has historically led to a near-term market bounce. The best performance occurred over one week when the index rallied 78% of the time. Moreover, recent cases have shown an even stronger tendency, with no losses over the last 10 signals. However, the one-week horizon represented the peak for the win rate, which dropped to 56% at the two-month mark, suggesting a bounce and retest scenario.
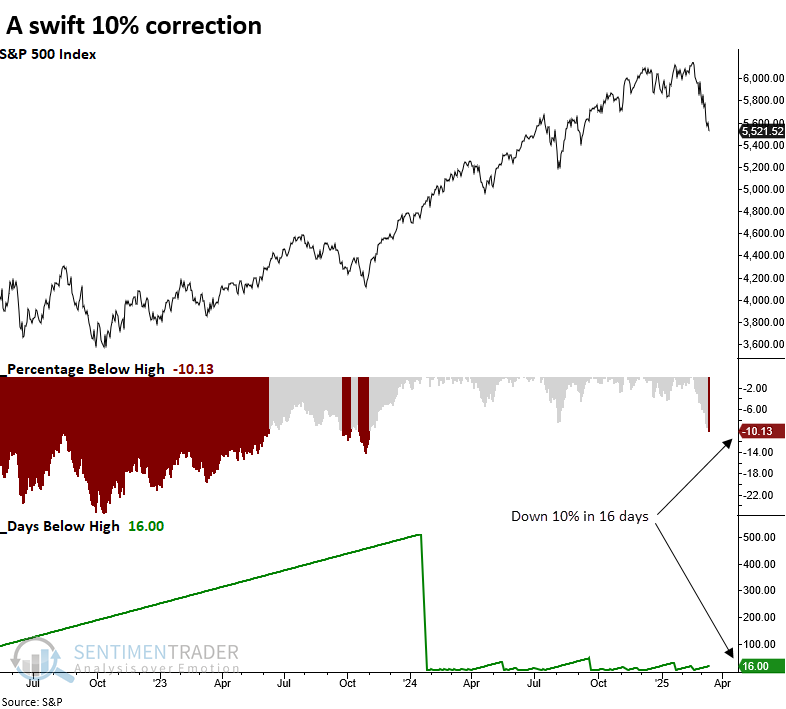
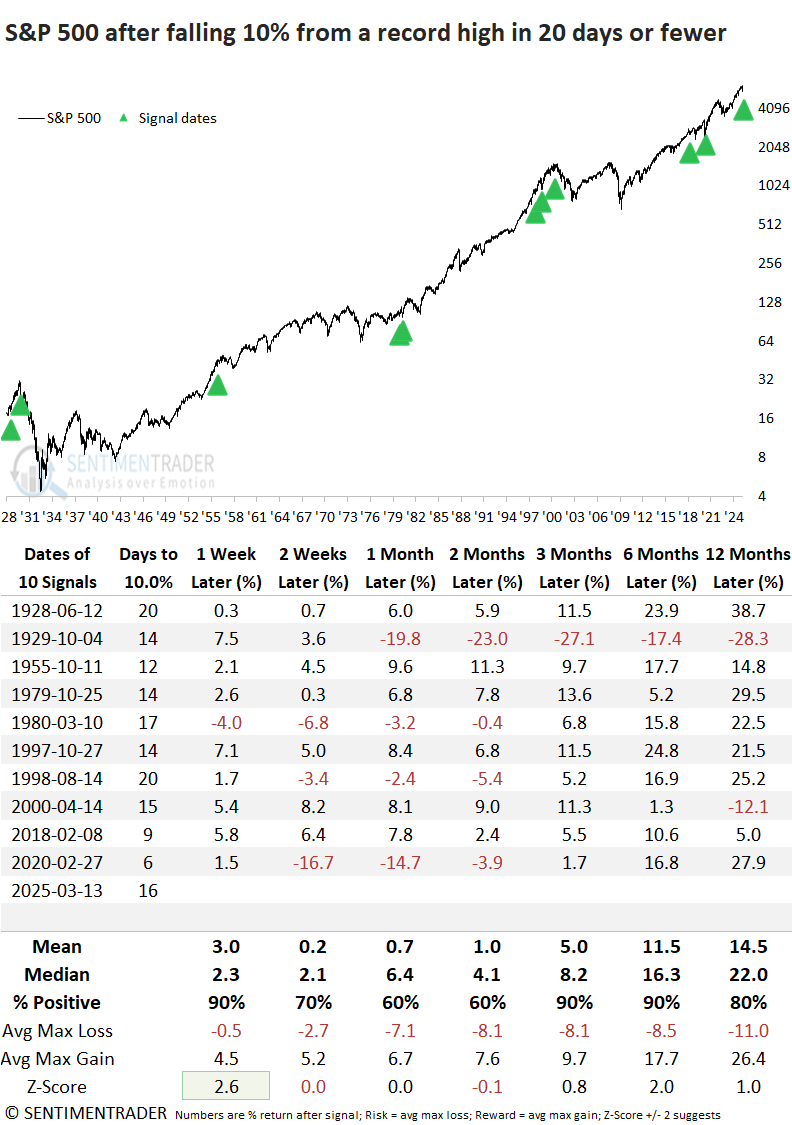
The S&P 500 declined 10% in only 16 sessions, the 8th swiftest drop in history. Let's analyze 10% corrections from an all-time high in 20 sessions or fewer.
Rapid pullbacks from an all-time high demonstrated a heightened ability to recover, with a 90% win rate during the first week. However, as with all signals, stocks tended to lose momentum and fade by the two-month point.
An interesting scenario
As the S&P 500 and other indexes experienced a sharp decline over the past three weeks, I kept an eye on my breadth composite, which I've highlighted in previous reports, for signs of an oversold condition. Surprisingly, the composite never turned negative, even with the 10% correction. This led me to question when similar situations have occurred historically.
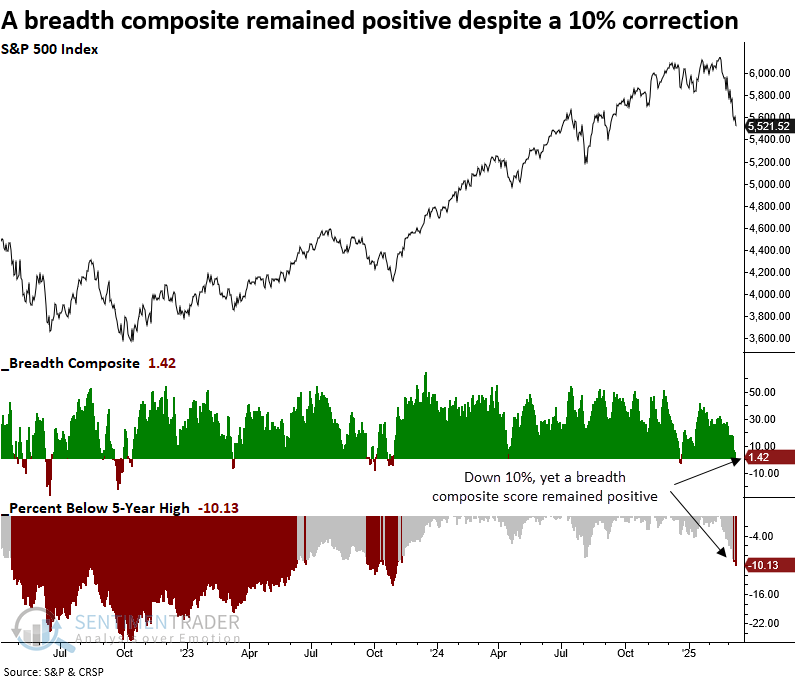
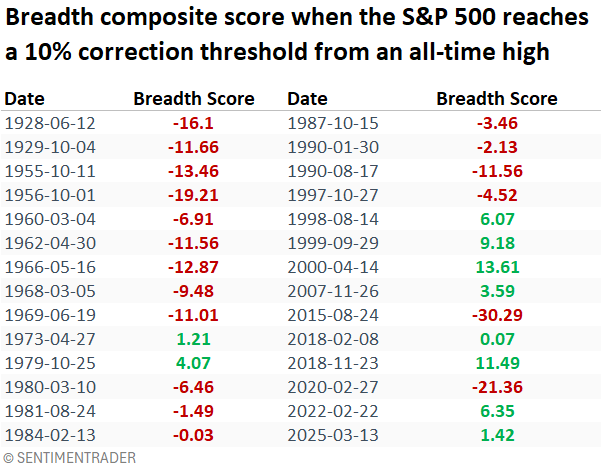
The following table shows historical instances when the S&P 500 hit a 10% correction from an all-time high, along with the breadth composite score recorded on those dates. There appears to be a character change in breadth since 1998, with most instances showing a positive score.
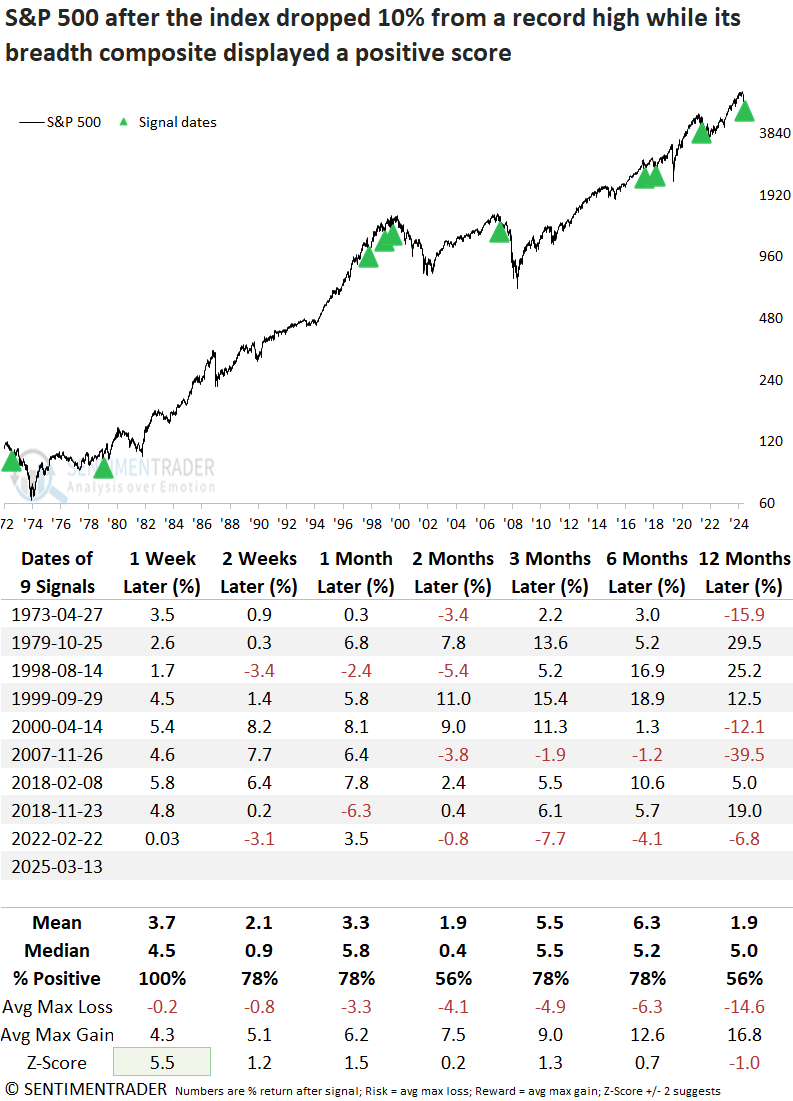
Whenever the breadth composite score remained positive despite a 10% correction from a record high, the world's most benchmarked index bounced 100% of the time over the subsequent week.
Consistent with other studies in this report, the S&P 500 index tended to fade around the two-month mark. Additionally, the one-year win rate was only marginally better than 50% and notably lower than the usual outcome for this timeframe.
What the research tells us...
The industrial metal with a PhD in economics, copper, has diverged sharply from the S&P 500, trading near the upper end of its 6-month range while the S&P 500 hovers around the bottom of its range. Similar divergences suggest investors should trust the market message from stocks rather than Copper, as both assets displayed unfavorable returns and win rates over the next year. Furthermore, several of the precedents coincided with significant downturns in equity indexes. That said, nothing moves in a straight line, and now that the S&P 500 has corrected 10%, a relief rally seems in order, which may have begun today. Barring some major catalyst from the Fed or the new administration, a V-shaped bottom is highly unlikely. Consequently, traders should expect a retest of the lows in the weeks/months ahead and potentially something more significant, given some of the scenarios we've shared over the last few weeks. i.e., I would not rule out a 15-20% growth scare correction. As always, we must keep an open mind and remain flexible when the data changes.