
Massive capitulation in the utilities sector

Key points:
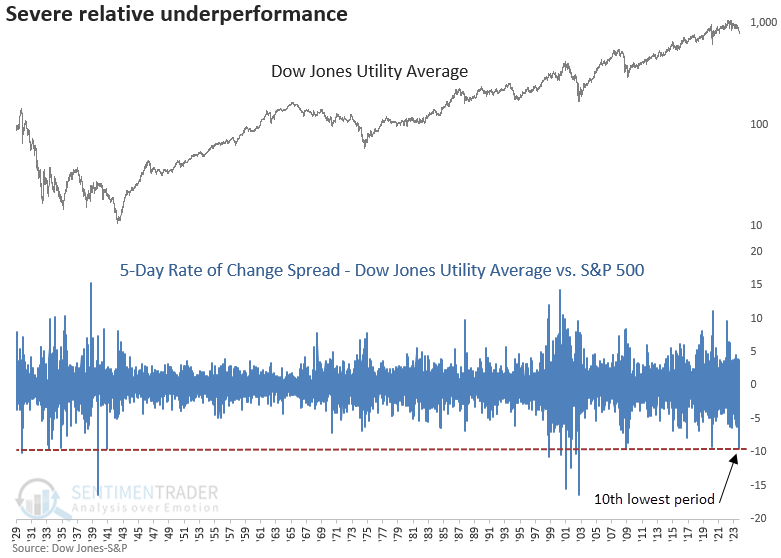
- Over the last five sessions, the Dow Jones Utility Average underperformed the S&P 500 by more than -9%
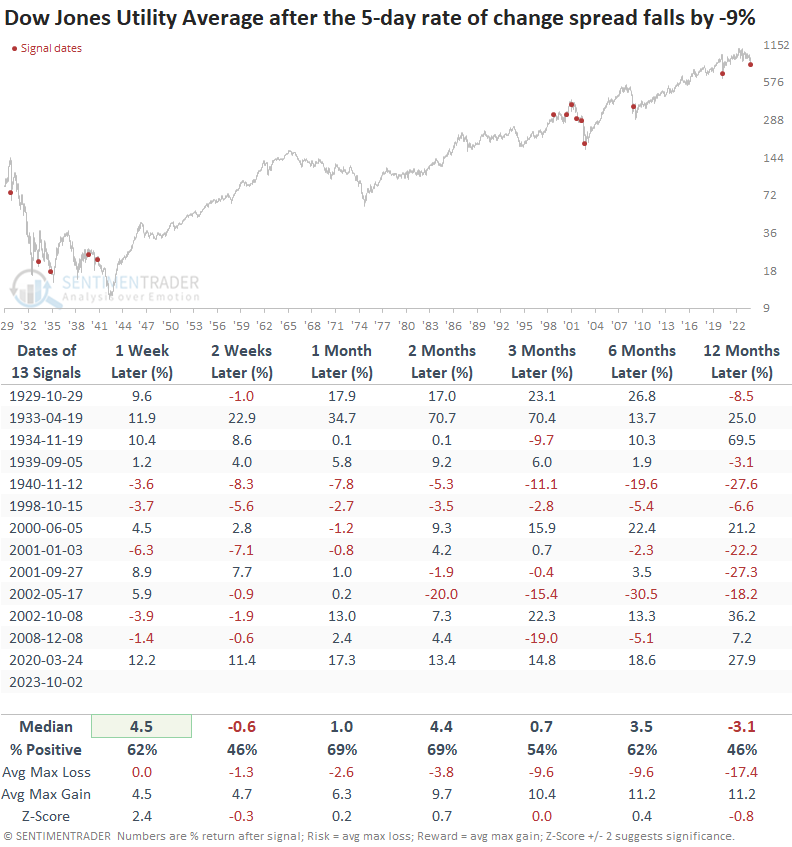
- Similar periods of short-term underperformance led to a rally over the next few months
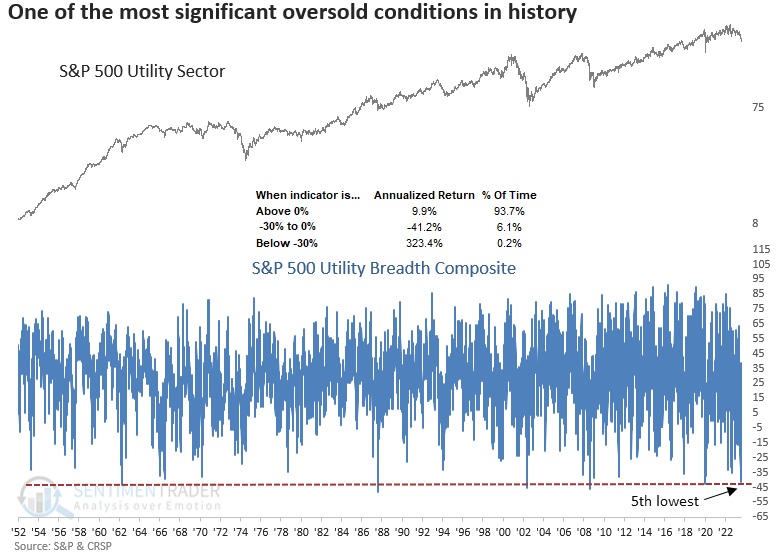
- A breadth composite for the utility sector plunged to one of the most oversold conditions in history
- After similar breadth-based circumstances, the utility sector showed a strong tendency to rally
An indication of capitulation at the index level
Investors have abandoned the traditionally defensive equity sectors like Consumer Staples, Health Care, and Utilities, with Treasuries offering enticing yields not seen in over a decade.
In particular, the utility sector is witnessing unprecedented destruction, evident at the index level and by internal market breadth indicators, marking one of the most severe capitulation events in over 90 years.
On Monday, the 5-day rate of change spread between the Dow Jones Utility Average and the S&P 500 plunged by more than -9%, the 10th most severe period of underperformance since 1929.
Similar periods of severe relative underperformance led to a bounce-back
When the Dow Jones Utility Average underperforms the S&P 500 by -9% or more over five days, the extreme selling pressure tends to diminish, with utilities bouncing back over the subsequent week. After some backing and filling in week two, the sector regroups but fails to extend upon the gains over the next few months. A year later, the median return was negative.
Except for October 1998 and June 2000, severe underperformance by the utility sector, like now, occurred in significant drawdown periods for the broad market. So, we need to be mindful of a potential market message.
An indication of capitulation from market breadth indicators
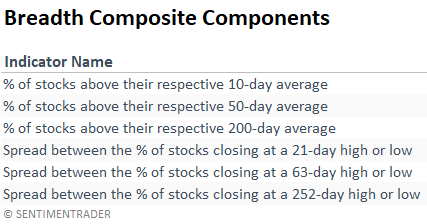
A composite that contains six market breadth indicators with varying duration lengths plunged to the 5th lowest reading in history, indicating severe downside participation from components within the S&P 500 Utility sector.
While a composite score of -30% or greater is scarce, the annualized returns associated with similar conditions suggest a massive snapback can occur when utility stocks are oversold, like now.
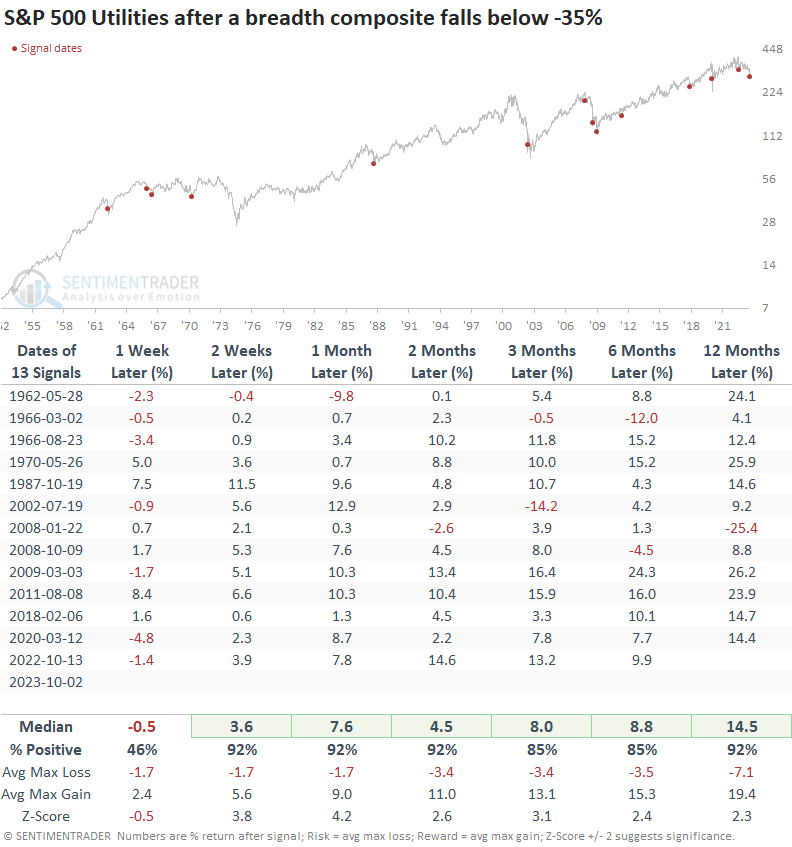
Similar composite washout signals led to outstanding results
When the composite score falls below -35%, the downside momentum in the S&P 500 Utility sector tends to persist over the following week. However, I would view further weakness as an opportunity, with returns, win rates, and z-scores showing outstanding results across medium and long-term horizons.
With the overall market in a drawdown, waiting for an oversold condition from other major indexes like the S&P 500 would be prudent to lend additional support to a mean revision rally.
What the research tells us...
The Utility sector, known for its ability to outperform during drawdown periods, has come under severe selling pressure as interest rates have climbed higher, providing a more compelling alternative for investors. However, the pendulum may have swung too far as external and internal measures show one of history's most severe oversold conditions. After similar circumstances, the sector tends to bounce back. I never catch a falling knife. So, waiting for a market-wide oversold condition and a reversal signal might be prudent before dipping a toe in the sand.