
Market overview: history in the making
It's been a wild week for markets, so I'll get straight to the point. The indicators that I follow point to the same market outlook: the stock market will most likely rally significantly over the coming months, but there's also a high probability that markets will first experience significant up/down volatility and potentially retest lows. Although the most recent crash (Q4 2018) did reverse upwards in a straight line, most historical stock market crashes saw significant up and down volatility before the market recovered.
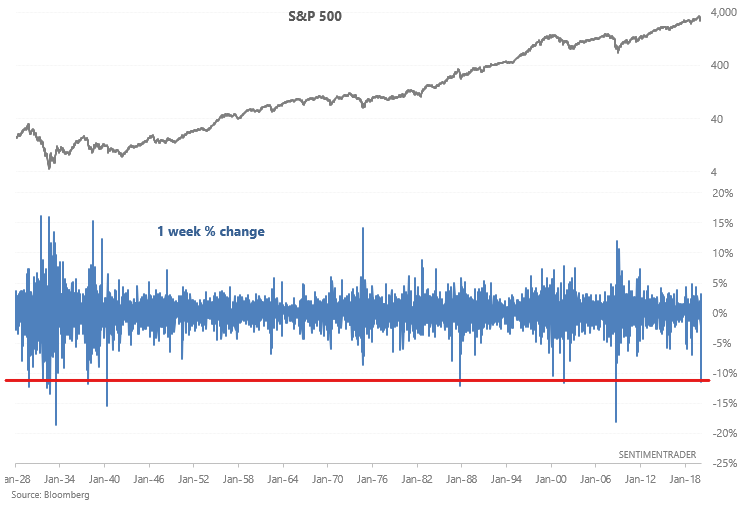
One of the worst weekly crashes in stock market history
The stock market's decline this week was one of the worst in history, matched only by:
- The 2008 crisis
- 2001-2002 bear market
- 1987 crash
- Great Depression
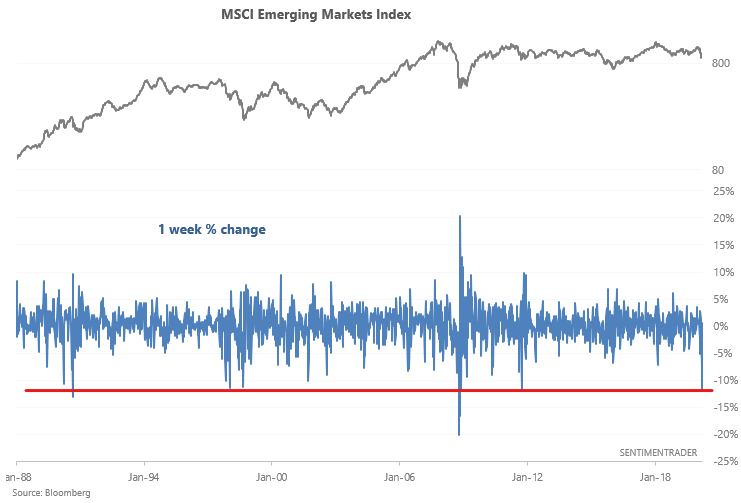
Similarly, this was one of the worst weeks in history for emerging markets:
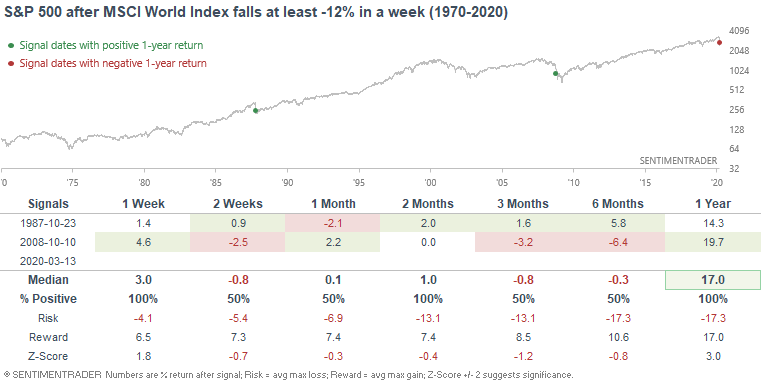
Combining developed and emerging markets, this was one of the worst weeks for global equities, matched only by the crash of 2008 and the crash of 1987:
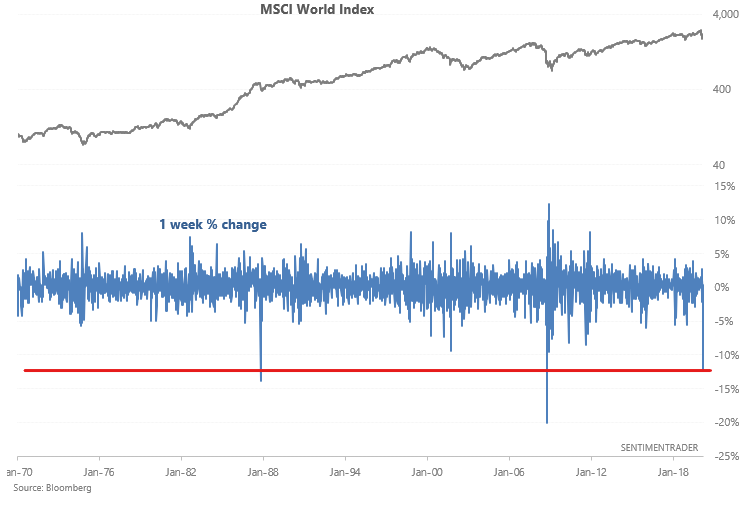
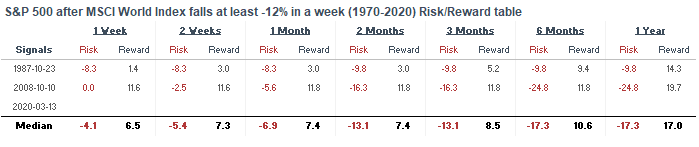
Both 1987 and 2008 saw massive up/down volatility in the coming weeks and months before stocks put in a meaningful bottom:
One of the worst weekly crashes in commodities history
Commodities crashed along with equities this week. Oil's 1 week decline was the largest since 2008:
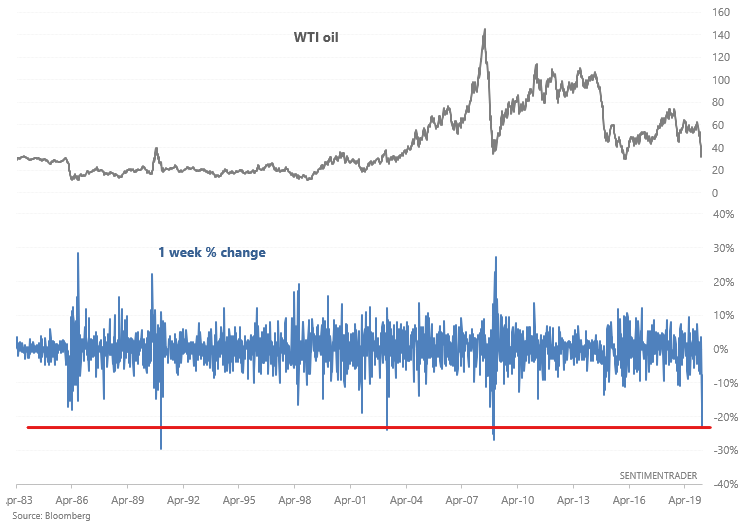
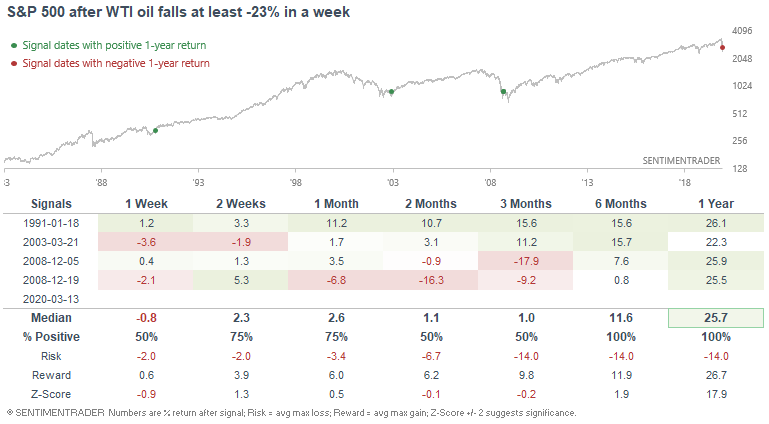
There were only a few other comparable historical cases, and all of them saw oil rally over the next few weeks and months.

While this wasn't always immediately bullish for the S&P, it led to a massive rally over the next year:
A classic sign of panic in corporate bonds: records being shattered
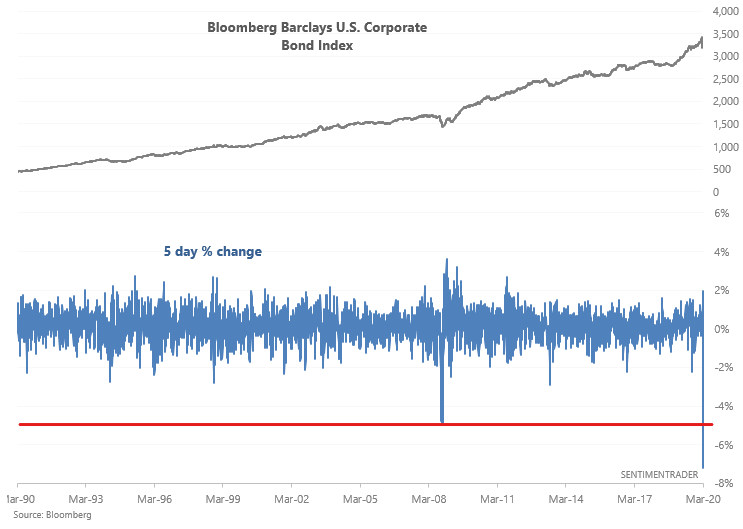
While bonds held up while in the initial innings of the stock market crash, the past week saw heavy selling in corporate bonds. The Bloomberg Barclays U.S. Corporate Bond Index fell by a record % over the past 5 days. This is even worse than selling during 2008:
Extreme swings
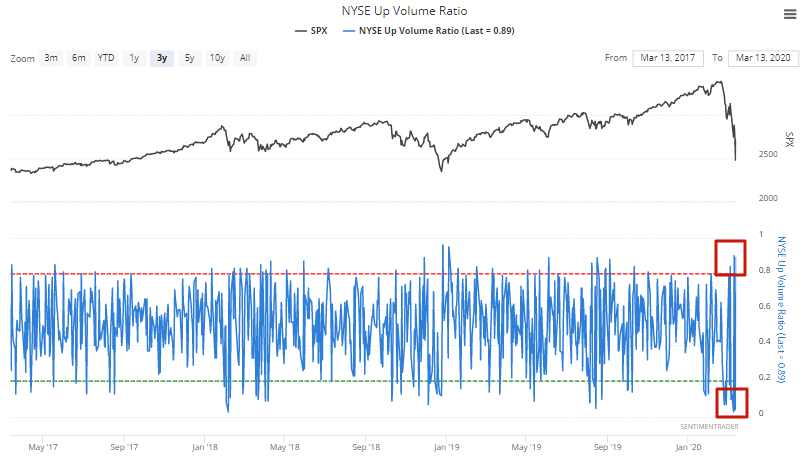
As Jason and I noted over the past 2 weeks, the stock market has experienced extreme swings up and down each day. Each of the past 5 days has seen either at least 85% of NYSE volume flow into issues that went up, or at least 85% of NYSE volume flow into issues that fell. This all-or-nothing attitude is extremely rare:
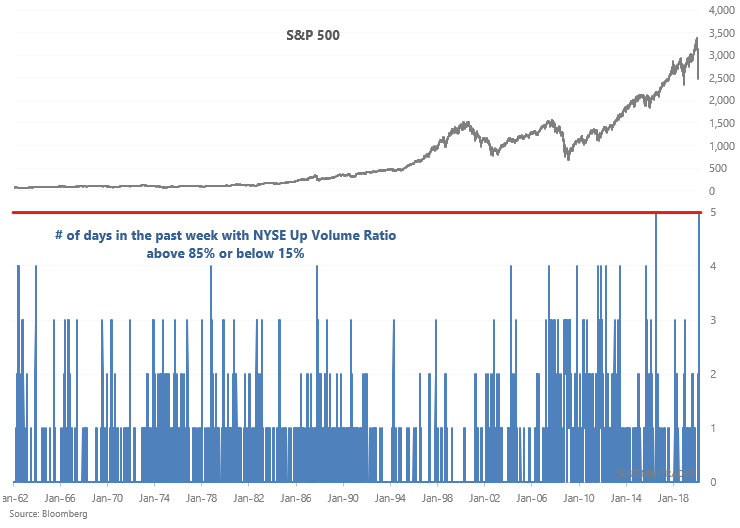
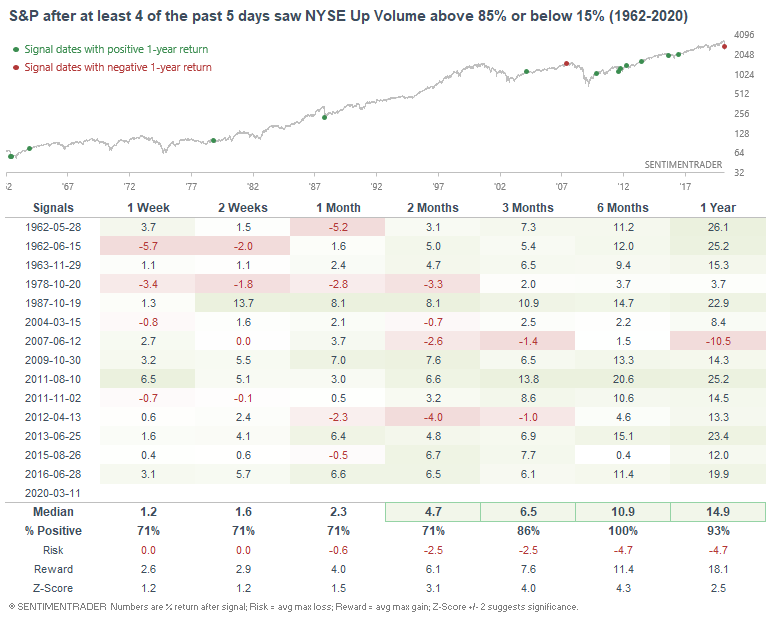
When the stock market was this choppy in the past, the S&P 500 always rallied over the next 6 months:
Record breadth
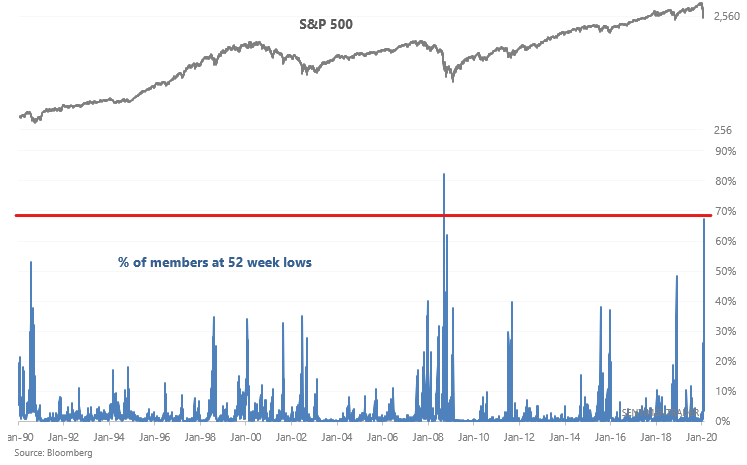
The stock market's bottom on Thursday saw some record breadth figures. It's hard to understate how extreme the selling was. For example, the % of S&P 500 members at 52 week lows could only be compared to that of the 2008 crash:
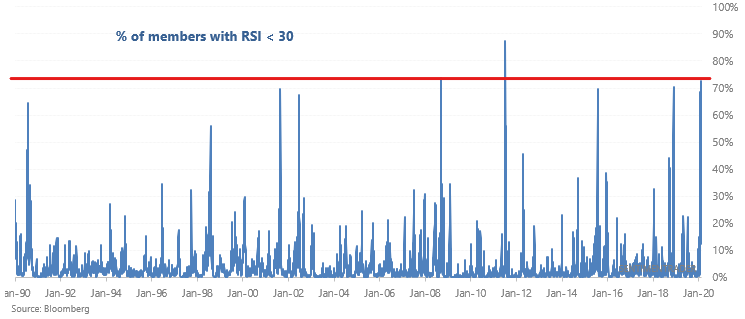
The % of S&P 500 members could only be compared to -20% to -50% historical market crashes:
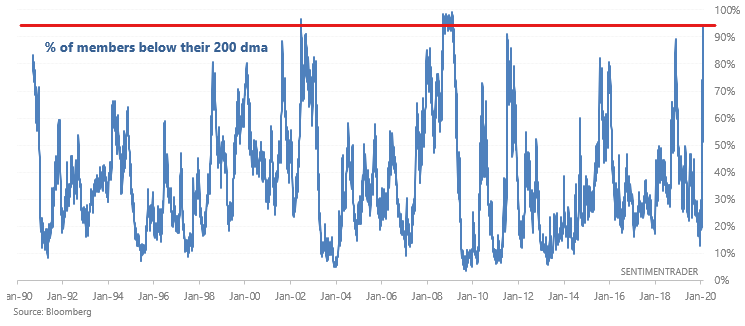
And the % of members below their 200 day moving averages could only be compared to the worst of the 2000-2002 and 2007-2009 bear markets:
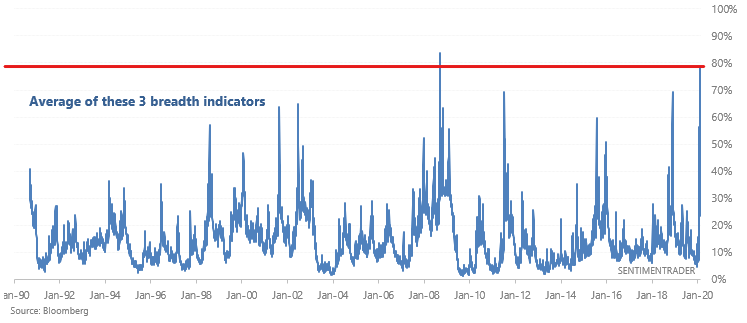
The average of these 3 crash breadth stats was 78%, a figure that is only comparable to October 10, 2008:
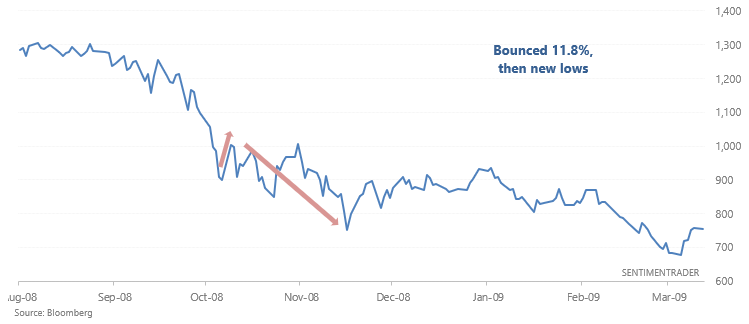
The S&P 500 rallied 11.8% after October 10 2008 (similar to the rally we saw on Friday), followed by new lows:
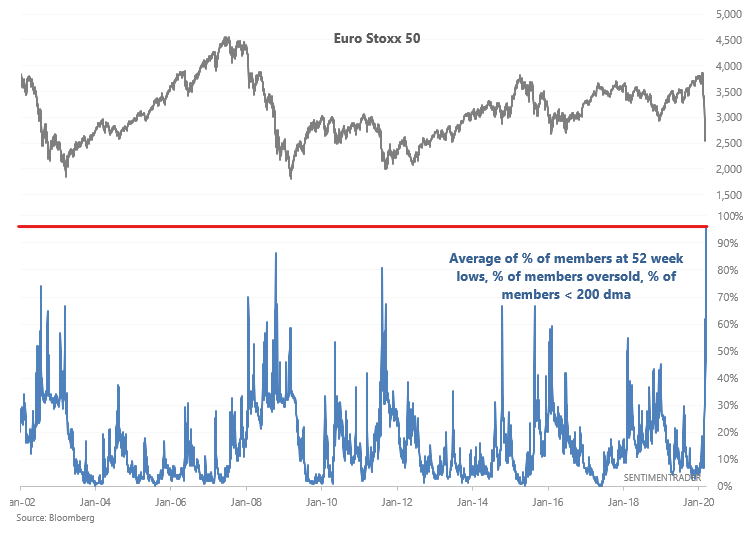
Records were being shattered in Europe. The average of "% of members at 52 week lows, oversold, and under 200 dma" saw its highest reading ever. Higher than during the 2008 crash:
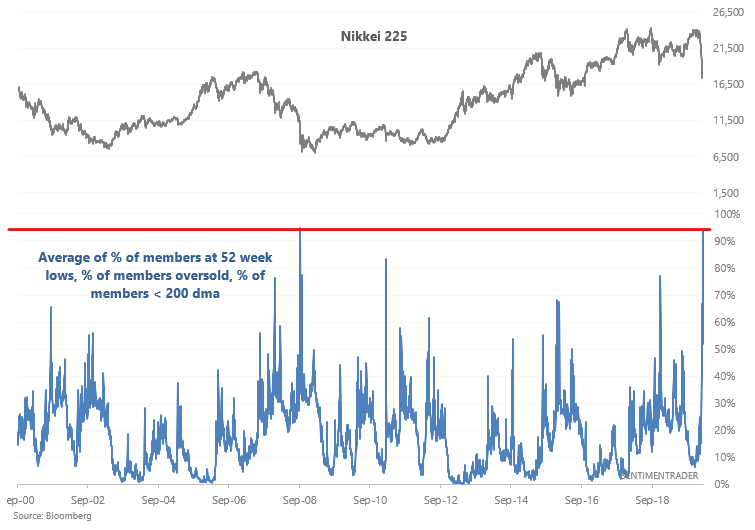
Similarly in Japan, this aggregate breadth figure was so extreme that the recent crash can only be compared to that of 2008:
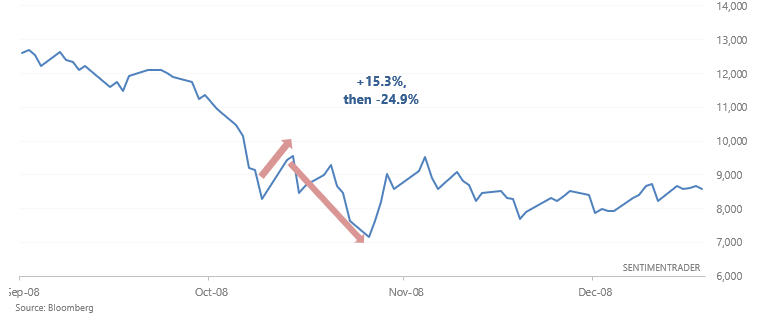
2008 witnessed the Nikkei jump 15.3%, followed by fresh lows:
Overall, the stock market's recent selling was extreme to the point where there are few historical comparisons. Expect massive short term swings in both directions.
Truly rare sentiment
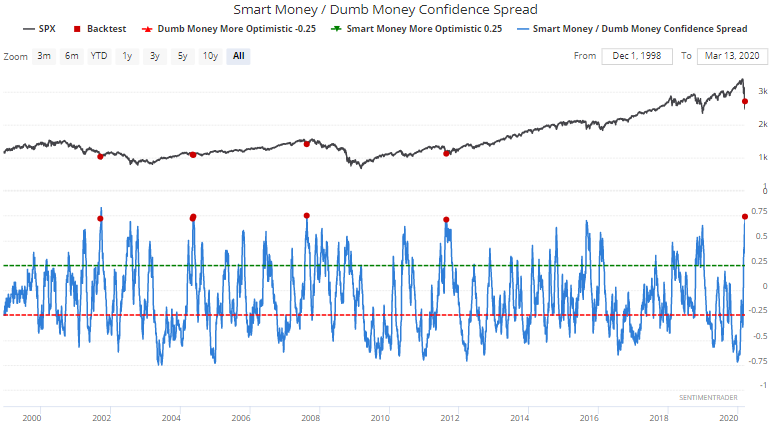
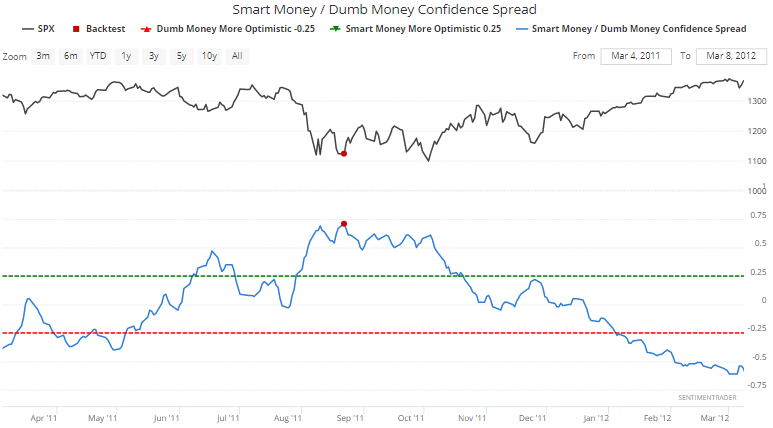
We're seeing truly rare and historic readings in sentiment. Our Smart Money/Dumb Money Confidence Spread is at one of the highest levels ever. When traders were this pessimistic in the past, it rarely paid to panic along with everyone else. Several of these cases saw immediate and massive reversals. Sometimes the bottom was just in, sometimes that was the exact bottom, and sometimes the bottom was 1-2 days away:
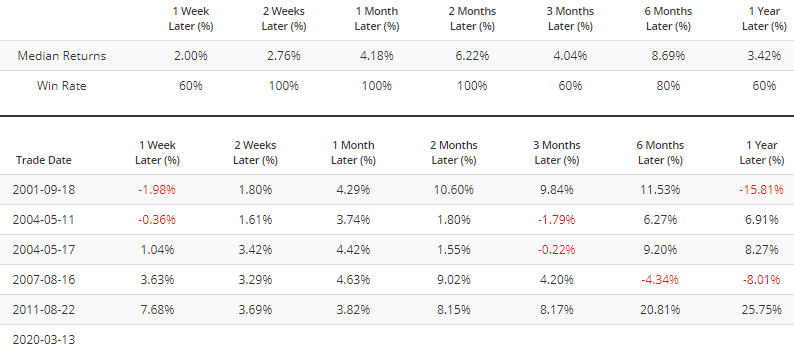
Let's look at the individual cases. There's August 2008, when sentiment was this extreme near the bottom of the crash. Stocks still bounced up and down over the next few weeks before a meaningful rally began:
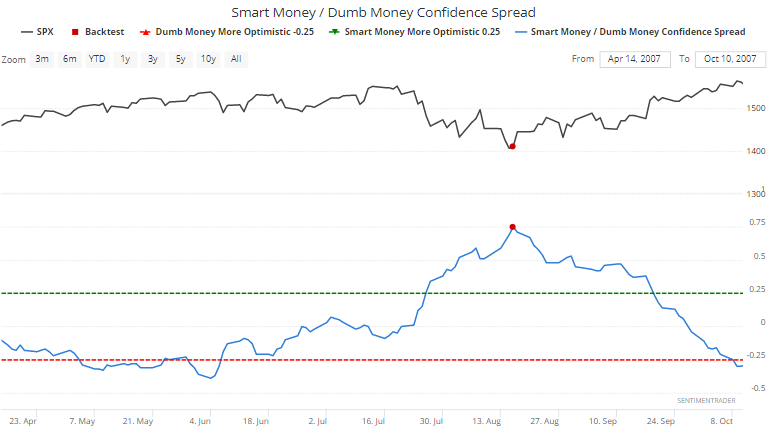
Here's August 2007. Sentiment was this extreme just as stocks bottomed:
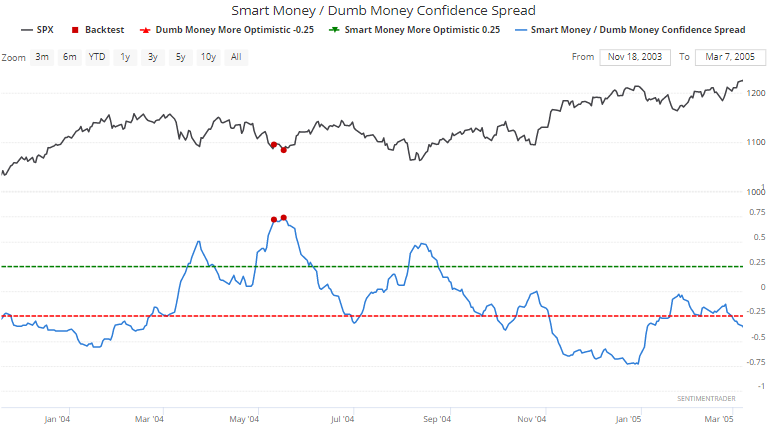
Here's May 2004. The S&P bounced and then made a marginal new low before the correction ended:
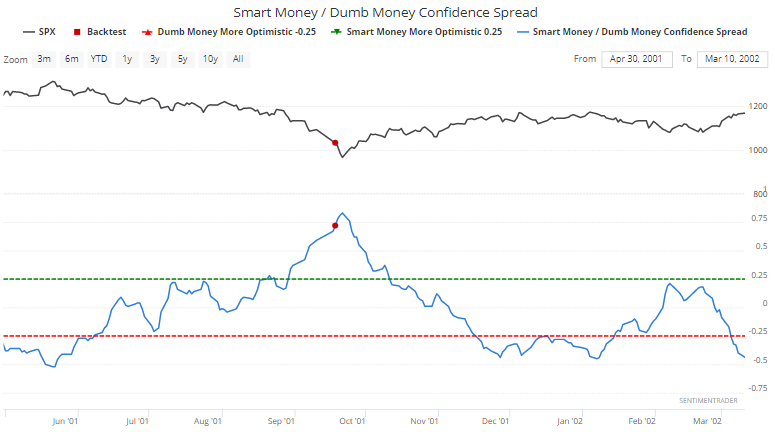
And here's September 2001. This came extremely close to marking the exact bottom of a major DOWN wave in the 2000-2002 bear market. Although the bear market did not end, the S&P 500 first made a massive rally over the next few months:
The next few weeks will be critical to the stock market going forward. At this point, I'm not making long term predictions but instead taking 1 day at a time. The most likely path forward is for stocks to chop up and down sideways, followed by a more meaningful rally. After that, I'll need to re-evaluate market cases.