
Market Optimism and Complacency Reach Near-Historical Persistence Levels

Key Points:
- Core risk indicators have remained in "Risk On" mode for 85 consecutive days.
- The VIX has not touched 30 for 125 consecutive days.
- Historical data suggests deteriorating market risk-reward ratios.
Sustained Confidence
Investor risk appetite has persisted for weeks, and in fact, months. According to the "Risk On/Off Indicator," most of the 21 core metrics have stayed in "Risk On" mode for over 85 consecutive days.
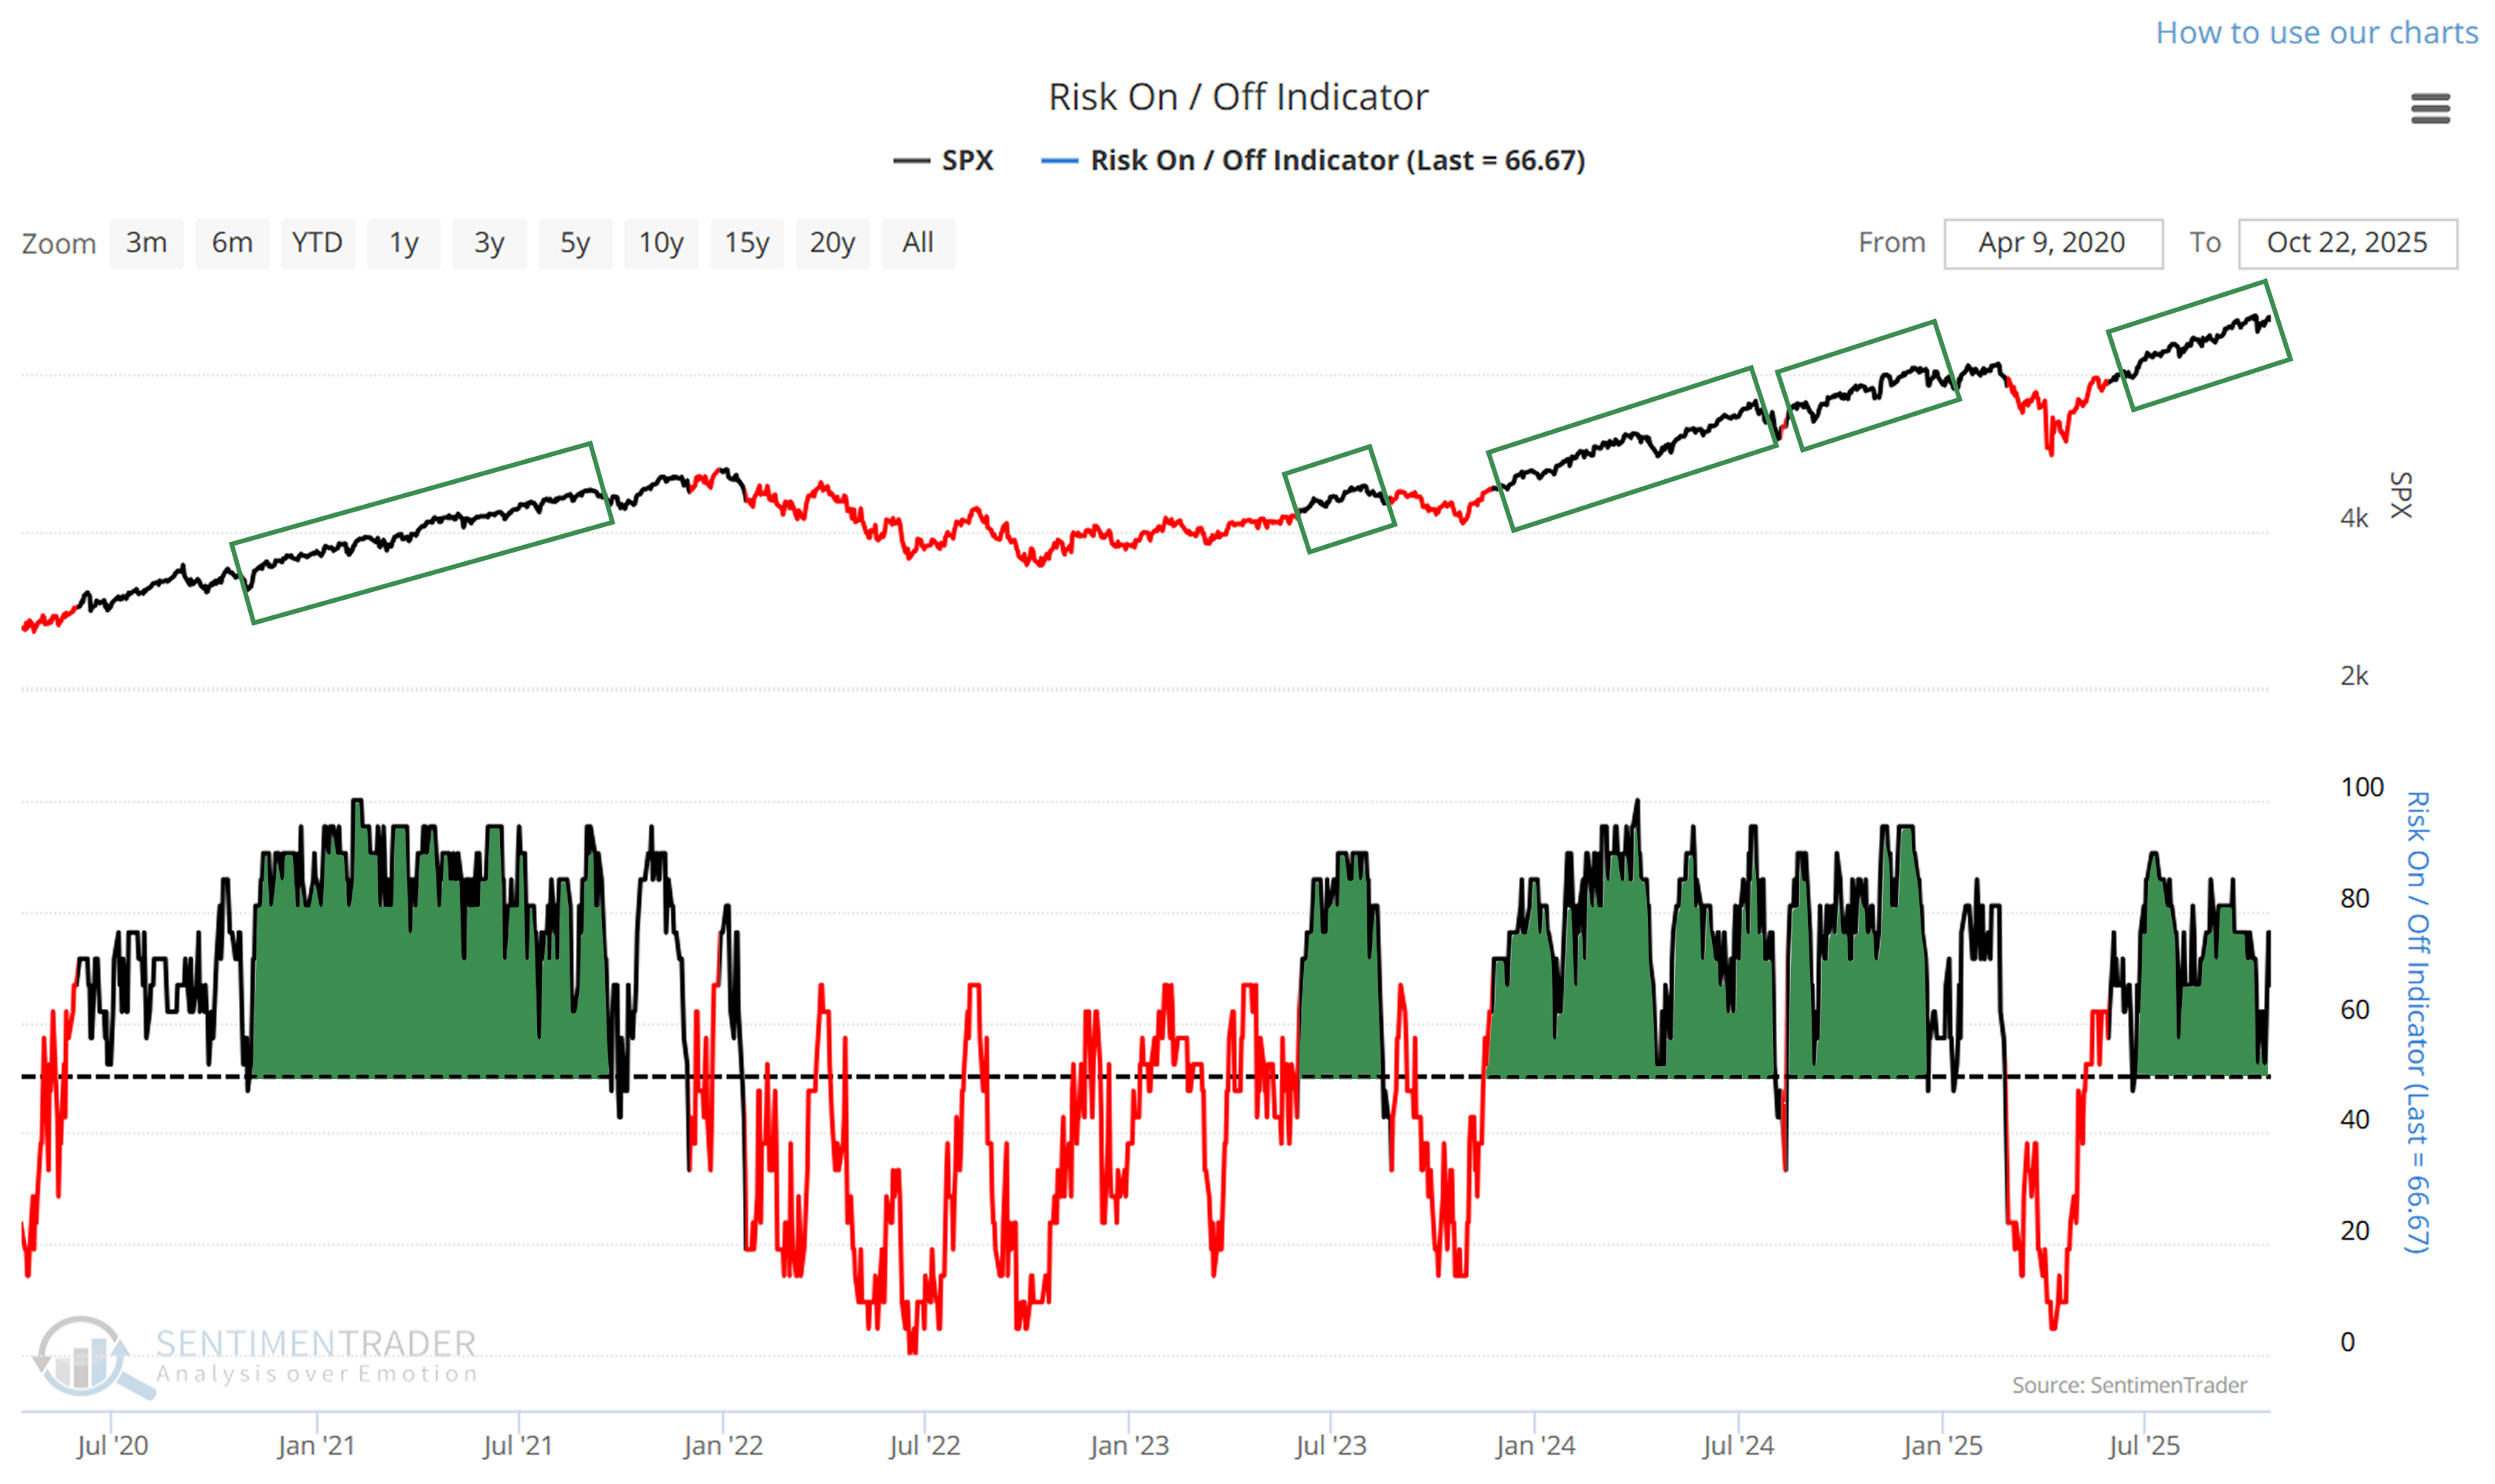
At the same time, the market's "fear gauge" is showing extreme persistence. The VIX (Volatility Index) has remained below 30 for 125 consecutive days, meaning the market has not experienced a significant panic event to reset this counter for more than six months.
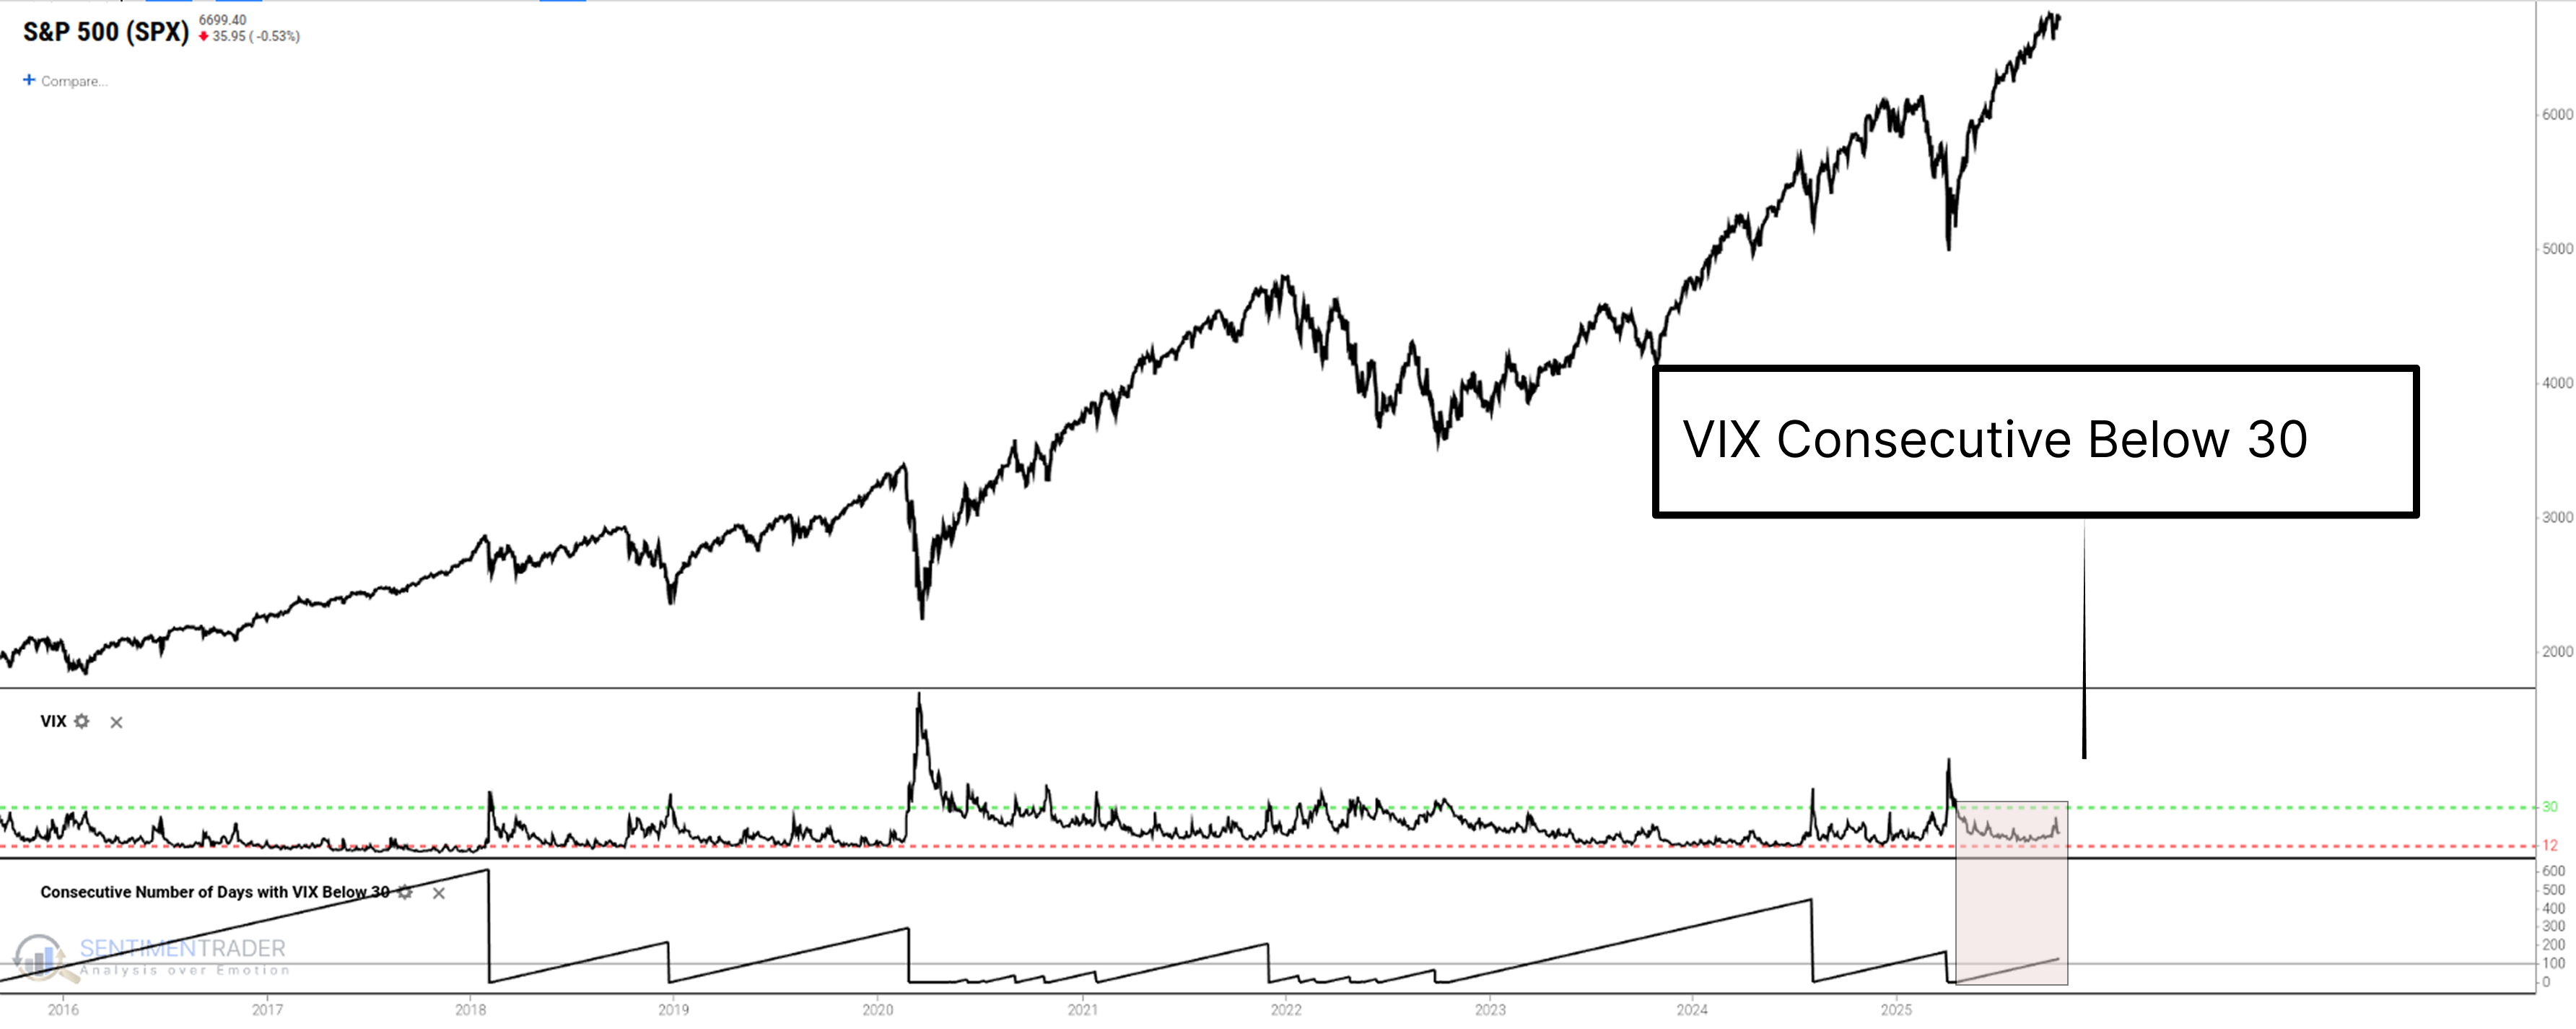
Recent events-such as volatility in rare earth markets pushing the VIX to 25-indicate the market is not entirely complacent. Instead, it may be entering a "high-risk choppy period" as shown in historical data: neither in full complacency below 20 nor extreme panic above 30.
Mixed Historical Returns
Prolonged investor risk appetite does not necessarily spell trouble for stock prices. However, historical data shows a shift in the distribution of risk and reward under such conditions. Notably, the risk windows predicted by these two signals appear to be staggered in time.
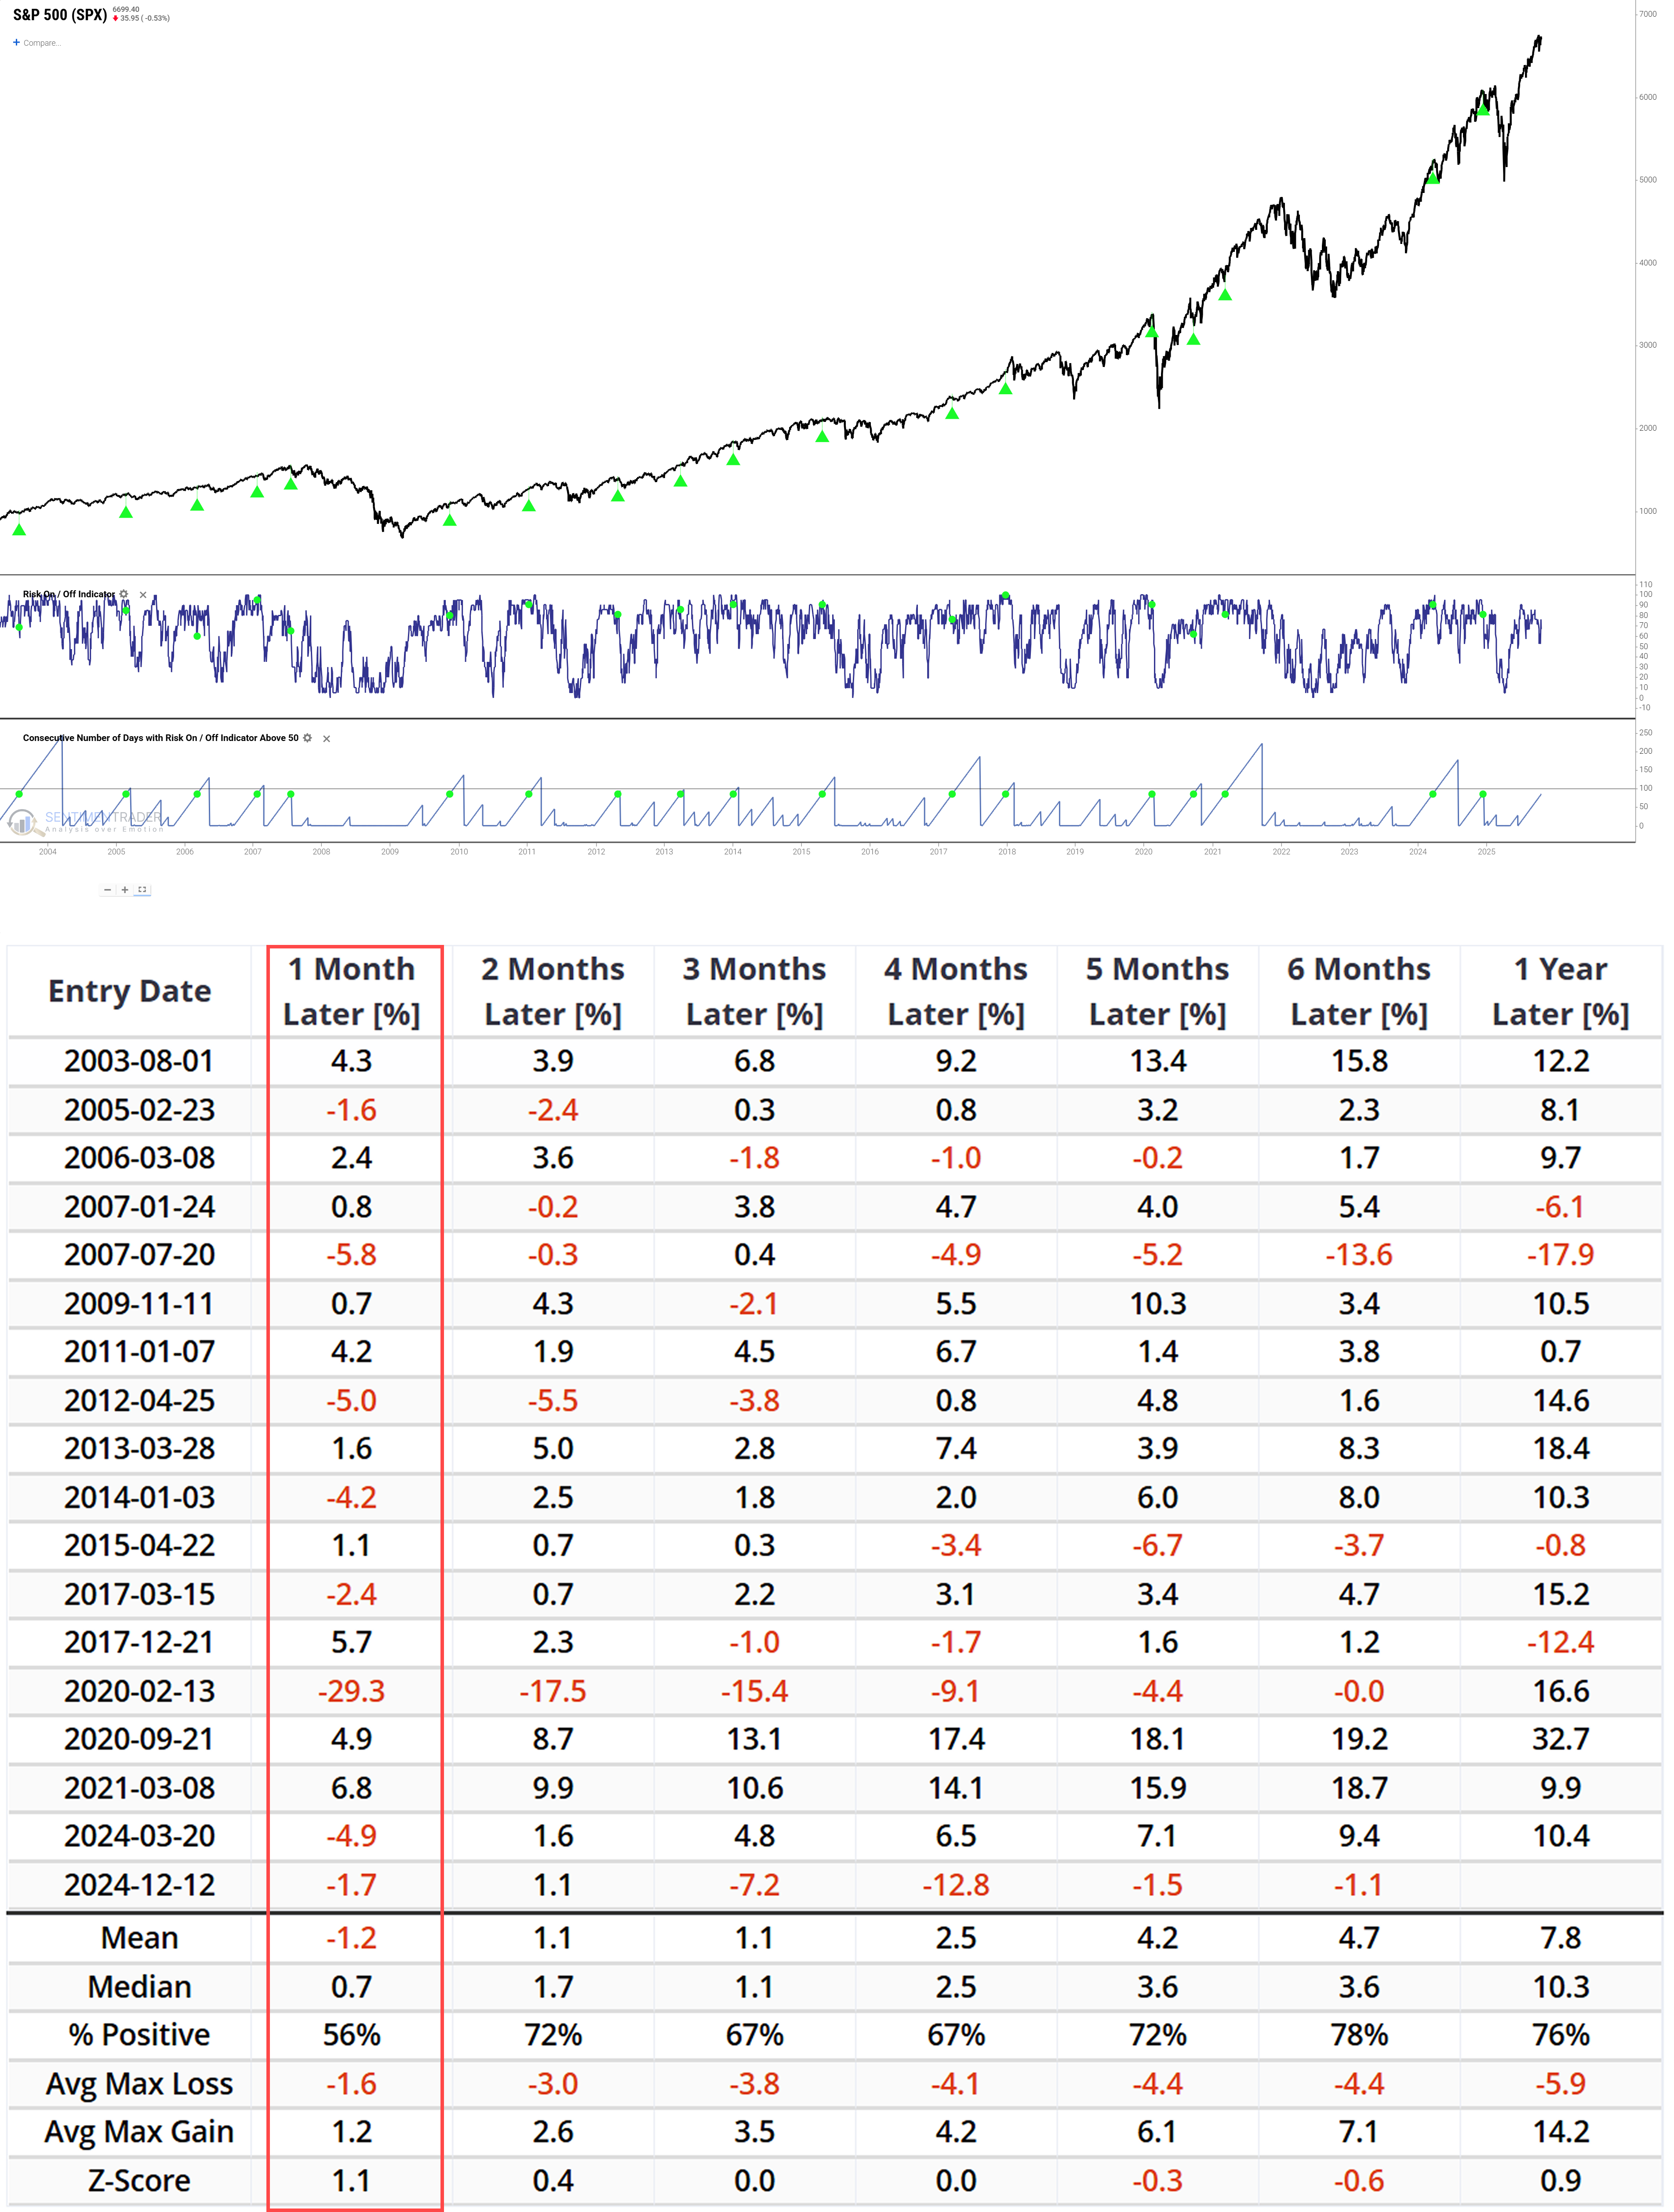
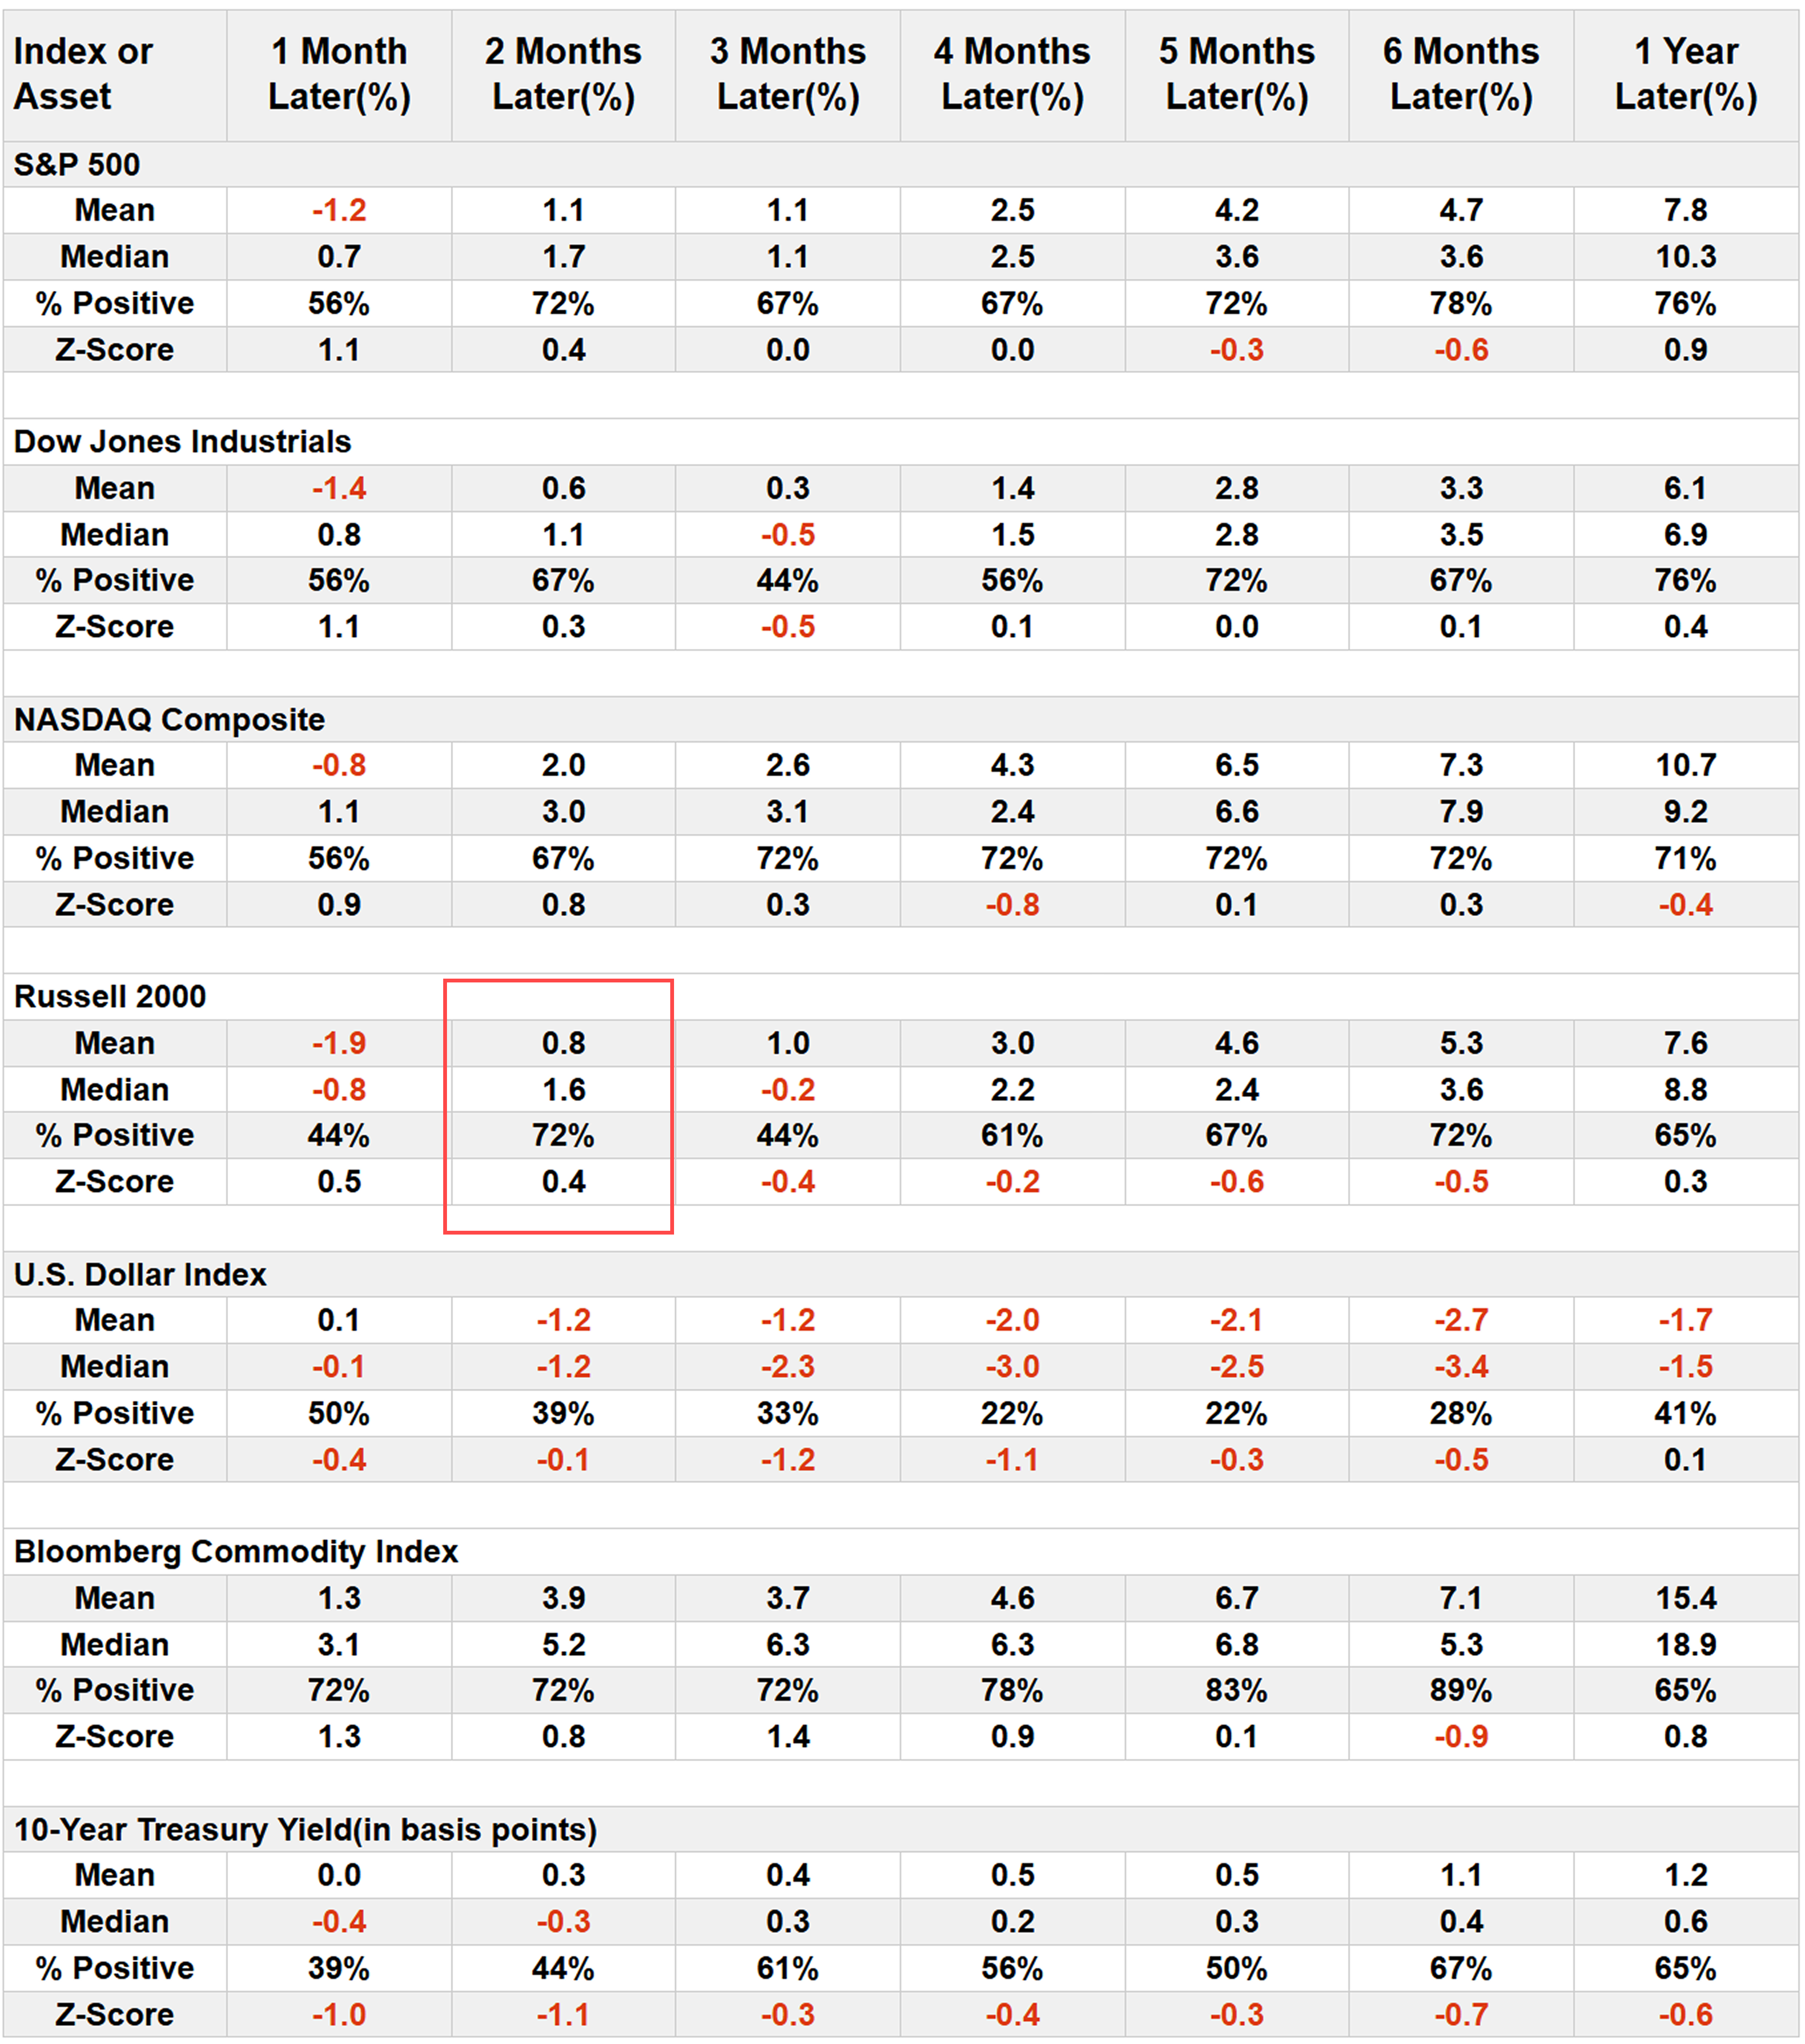
For the "85 days of Risk On" signal, risks are most immediate in the 1-month horizon, revealing deteriorating risk-reward dynamics. While the median 1-month return is a modest +0.7% with a 56% upside probability, the average return falls to -1.2%.Related Backtest Click Here.
For the "125 consecutive days of VIX below 30" signal, peak risks seem delayed until the 2-month mark. Backtest data shows the S&P 500's median 2-month return drops to -0.1% with a 47% upside probability, indicating a typical outcome of flat or slightly negative performance.Related Backtest Click Here.
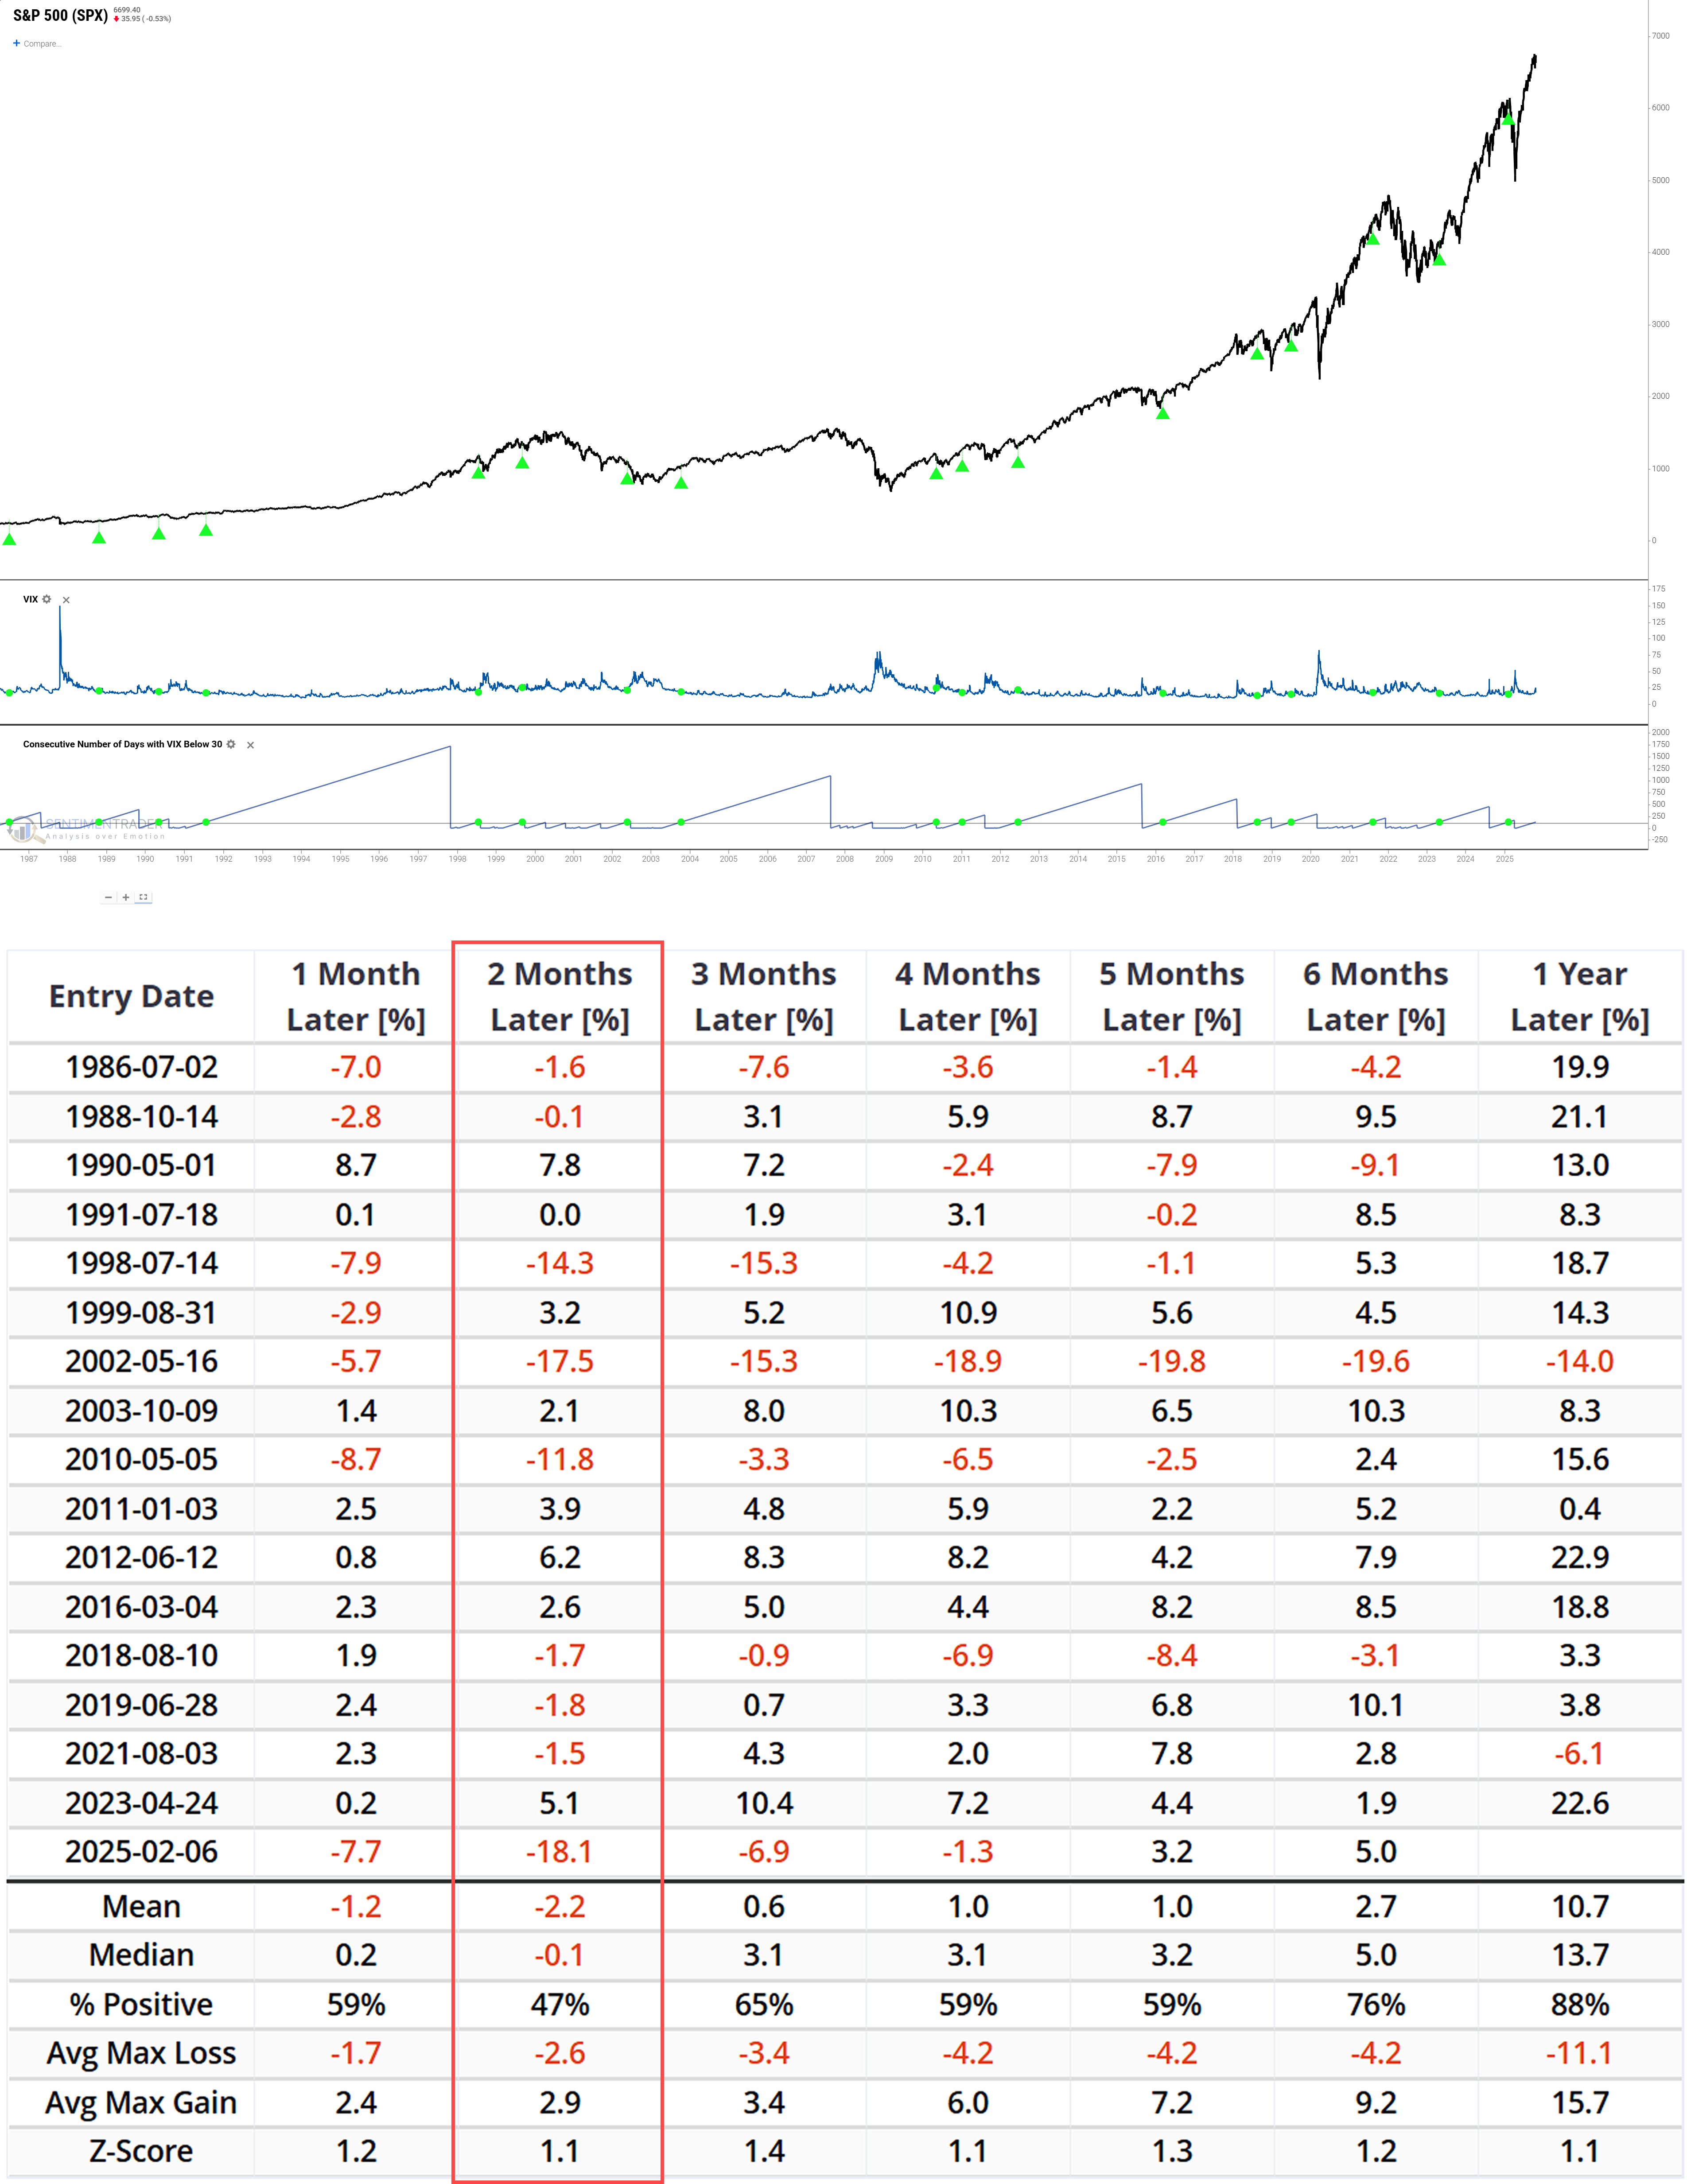
This significant divergence in the key risk periods (1 month vs. 2 months) between the two signals serves as a statistical warning. It suggests the historical sample includes severe downturns that drag down the average-known as "left-tail risk"-tilting overall risk-reward dynamics to the downside.
Divergent Performance of Risk Assets
Backtest engine data reveals that among major stock indices, the small-cap Russell 2000 Index underperforms significantly following these signals.
After the "Risk Measure signal" is triggered, the median 1-month return falls to -0.8% with an average return of -1.9%, indicating higher-risk market segments may face greater pressure in this environment.
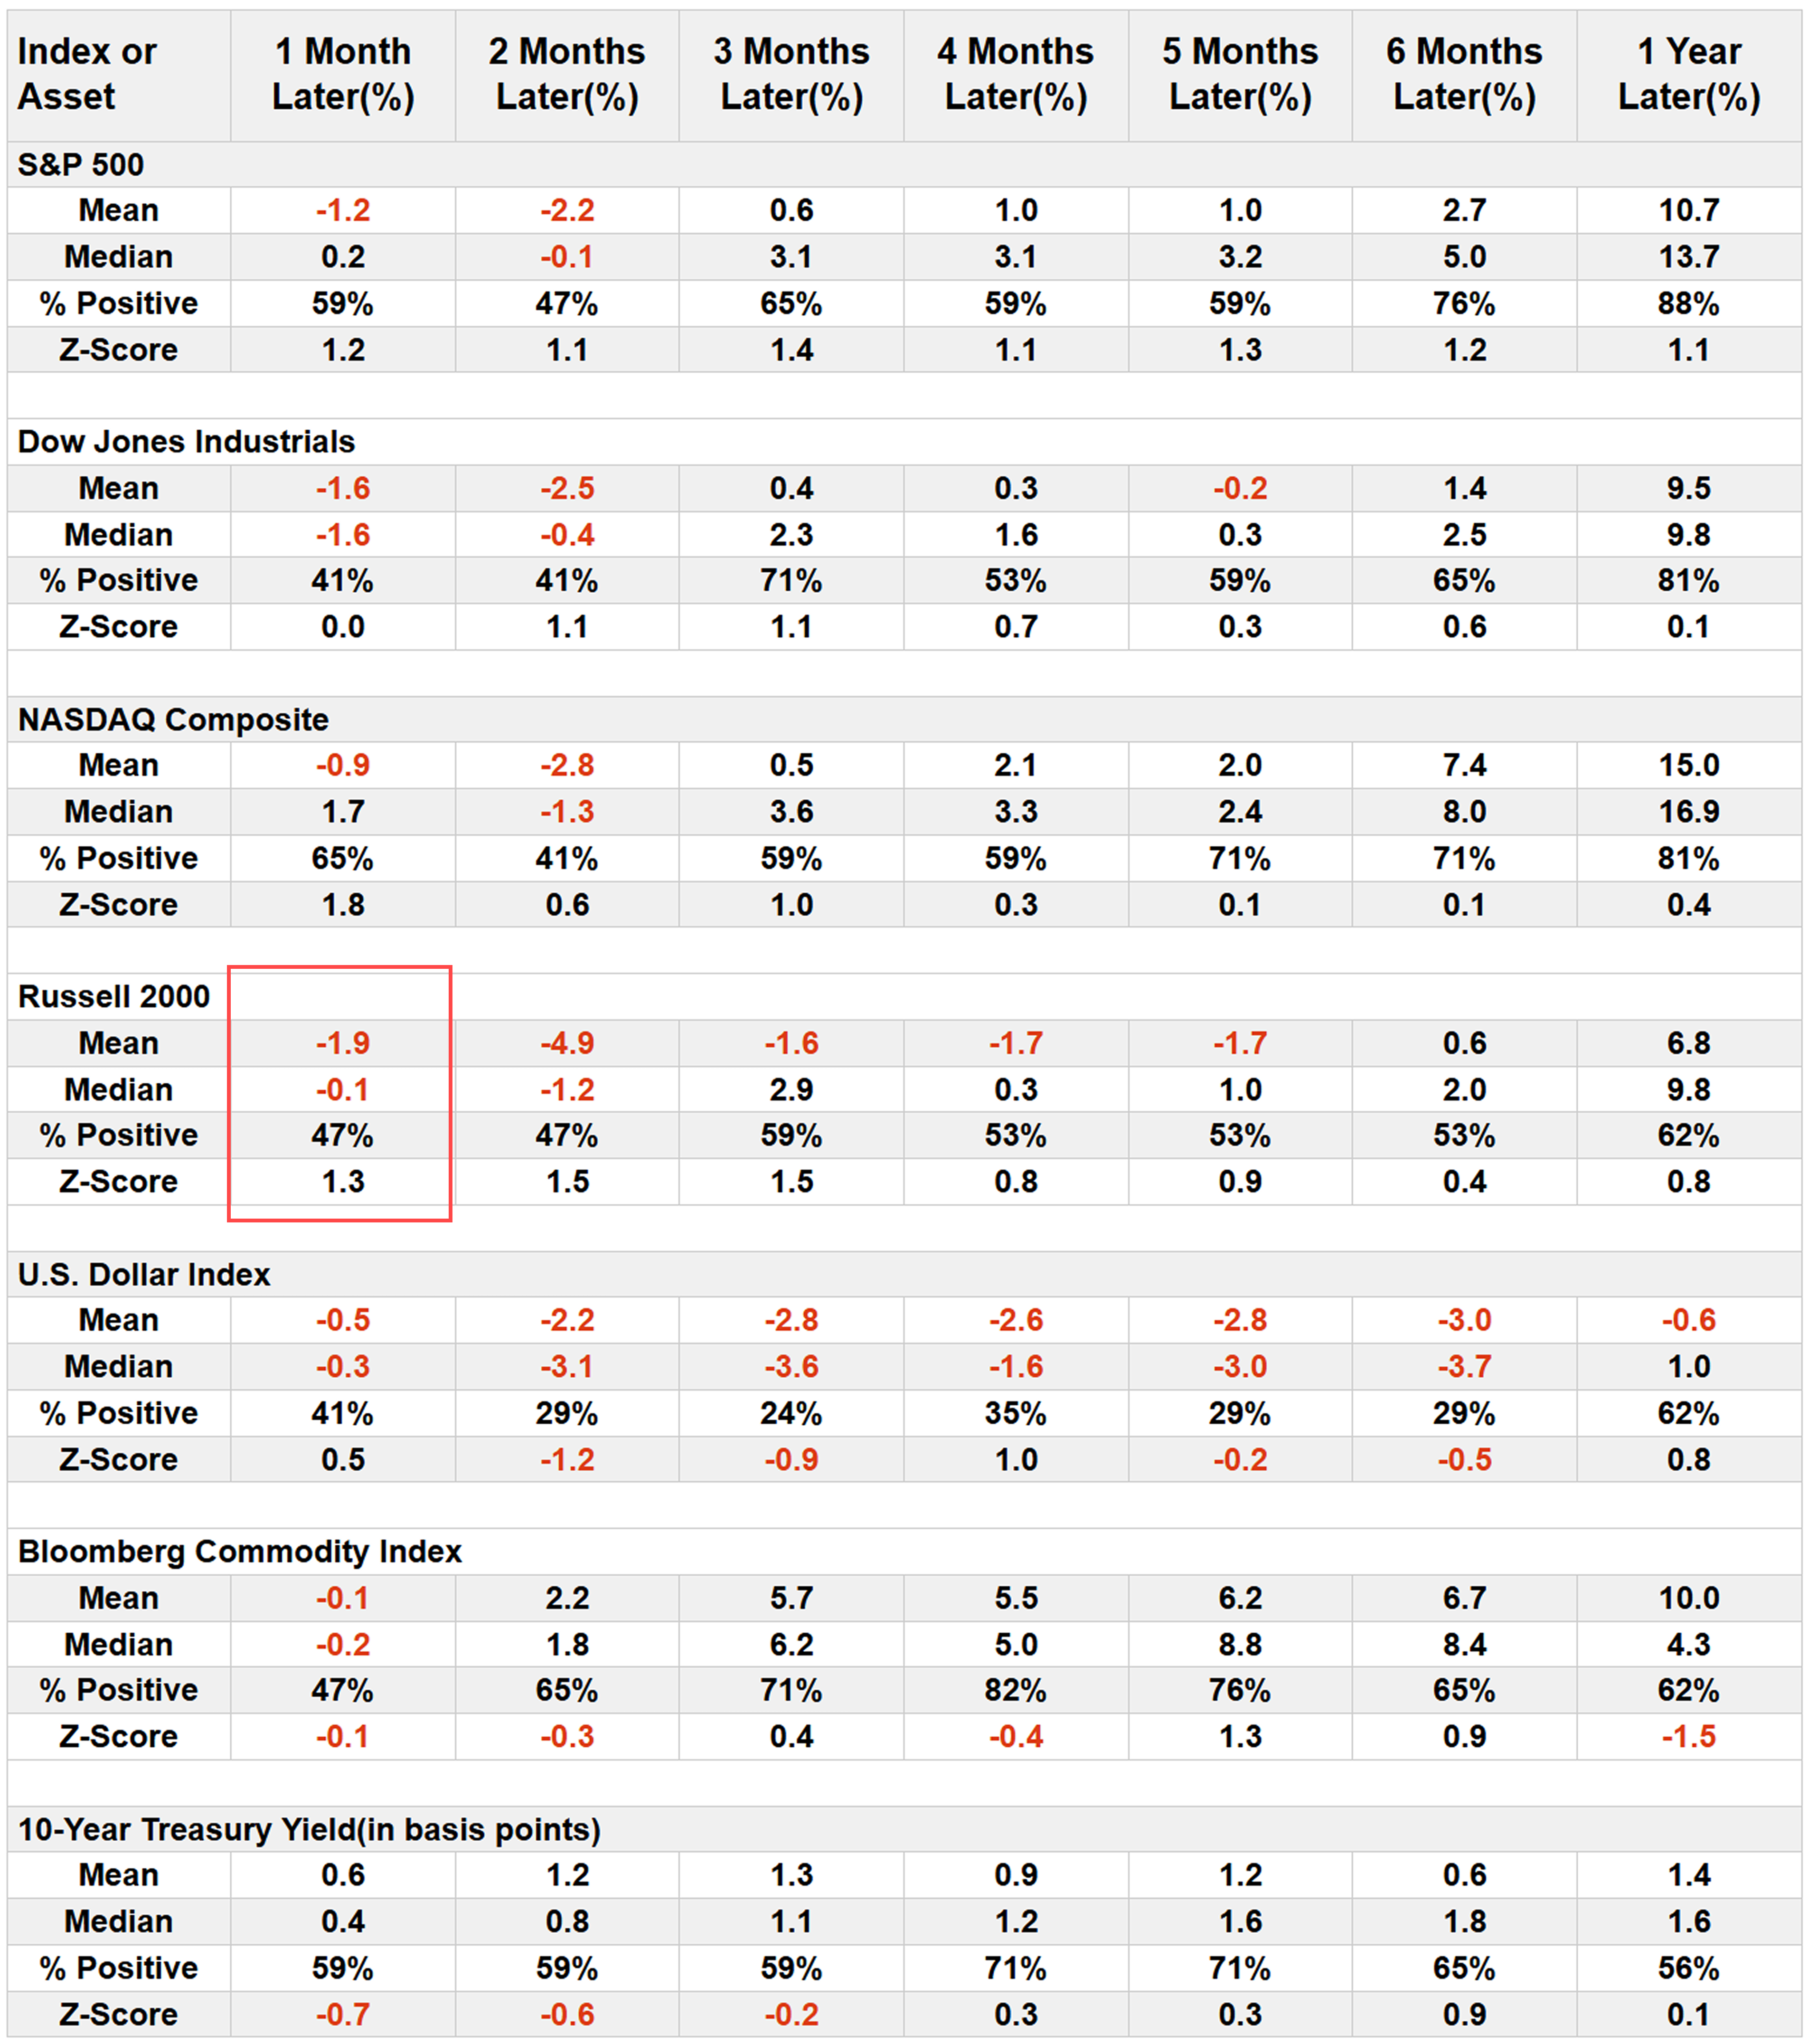
Following the "VIX signal," the Russell 2000's median 2-month return drops to -1.2% with an average return of -4.9%.
What the Research Tells Us...
Sustained investor confidence and the market's ability to maintain this state suggest the potential for a strong long-term bull market. This is supported by historical data showing a more than 75% upside probability for both signals over a 1-year horizon. However, it's crucial to note that current market structures differ from historical samples-factors like the impact of 0DTE options (zero-days-to-expiration options) and the potential macroeconomic cycle of interest rate cuts may affect the comparability of historical data.
Thus, while historical momentum may persist, the data indicates the most likely path over the next 1-2 months is flat returns with increased left-tail risk probability. This suggests the market may have exhausted its easy upside momentum, warranting a cautious stance.