
Market Momentum in the Energy Sector

Key Points:
- XLE 22% above 200-day Moving Average
- XLE Optix 10-day MA breaks 80
- Energy Sector Breadth New Highs Breakout
- Seasonality in Favorable Window
Sustained Confidence
When it comes to broad thematic market trends, we typically observe early movers first driving up the prices of the most obvious candidates before selling to trend followers. A similar pattern has emerged in the energy sector in recent weeks.Click here to view.
These maneuvers have pushed the popular XLE fund's share price 22% above its 200-day moving average.Related Backtest Click Here.
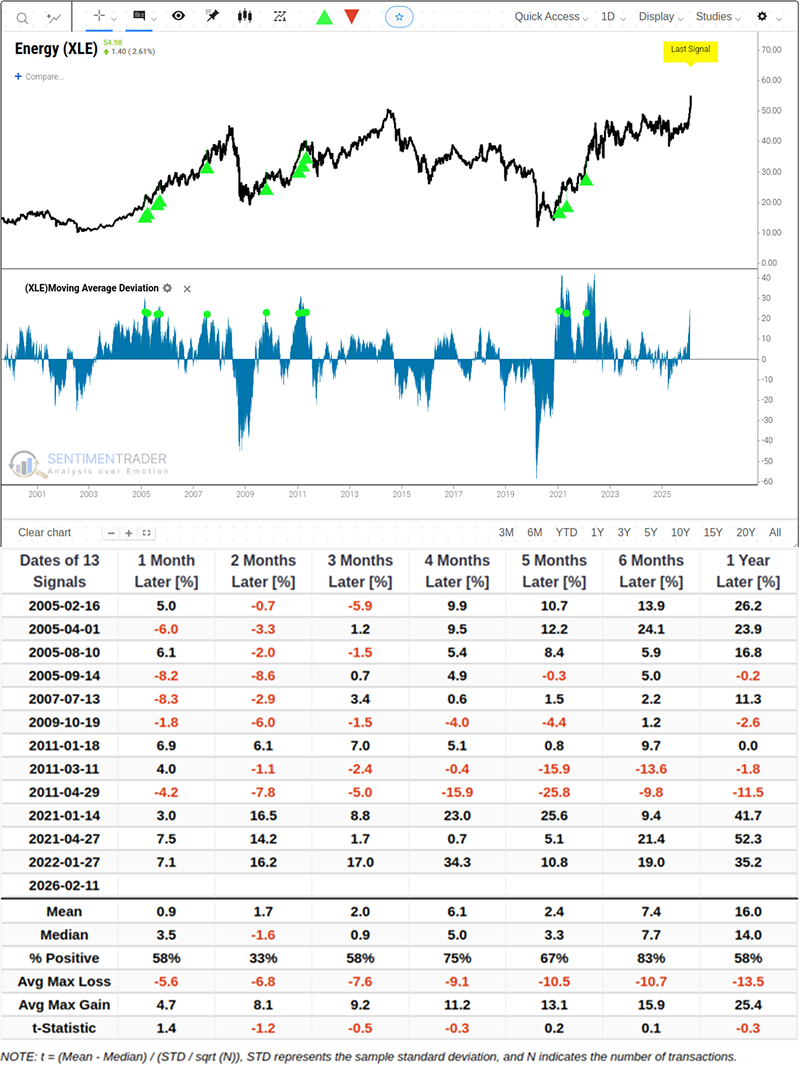
Historical data suggests that following similar deviations, the average return over the next month is only 0.9%, with unstable median returns. The win rate over two months is just 33%, implying that the market may face pressure for consolidation or a minor pullback in the short term.
Overheated Sentiment
By observing the market Optix, we find that optimism among market participants has reached extreme levels. The 10-day moving average of the XLE Optix index has recently breached the 80 threshold.
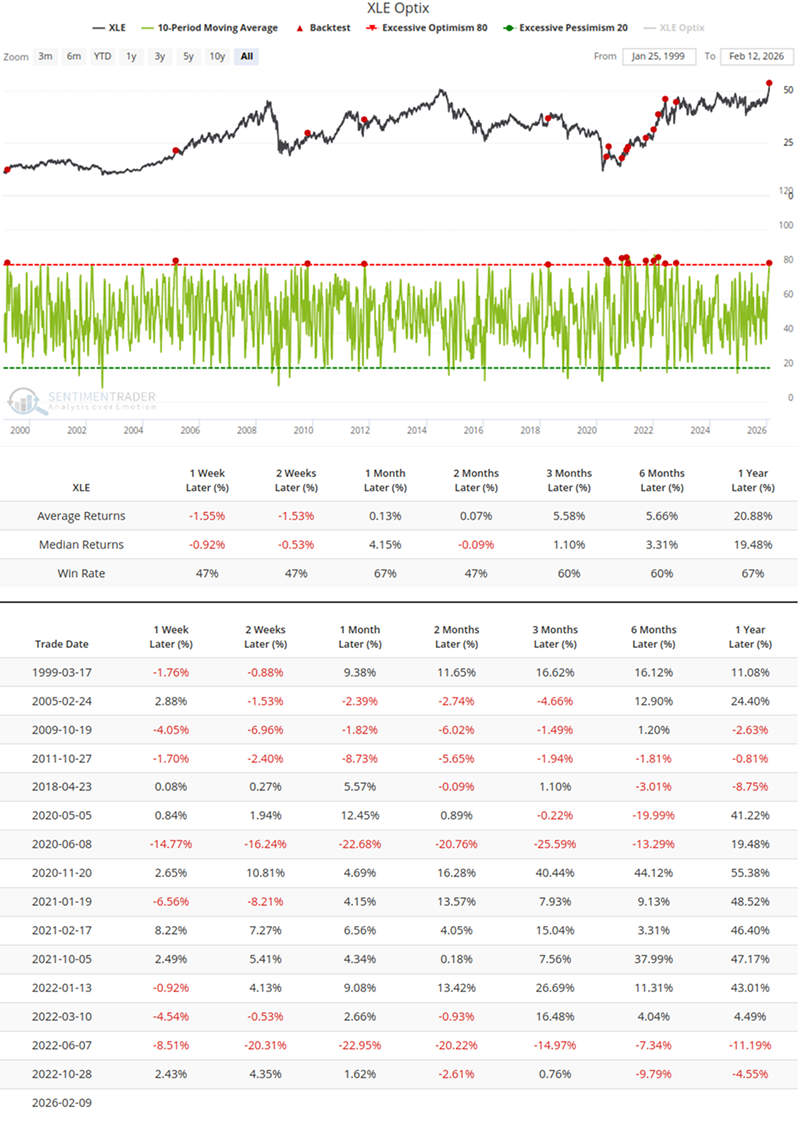
Statistical backtesting indicates that under these conditions, XLE's average returns in the subsequent 1-week and 2-week periods are negative, with a win rate of less than 50%.
Breadth Thrust & Long-Term Momentum
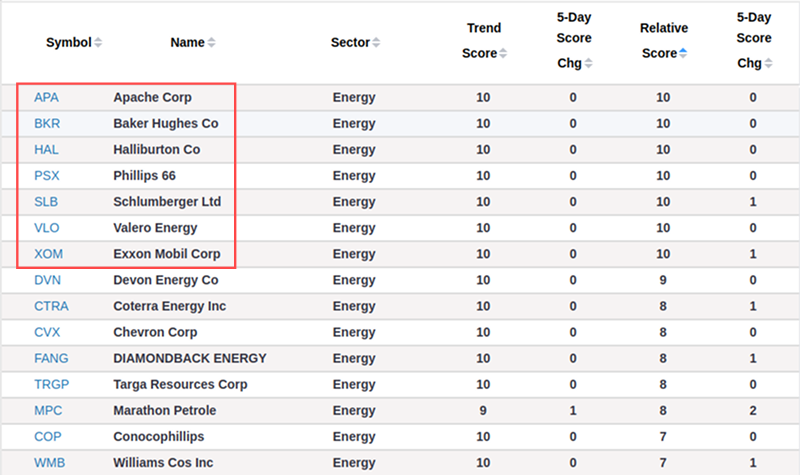
The percentage of stocks within the XLE sector hitting 52-week highs has recently broken through 60%. Simultaneously, the RSI indicator shows that over 50% of constituent stocks are in an "overbought" state (>70).
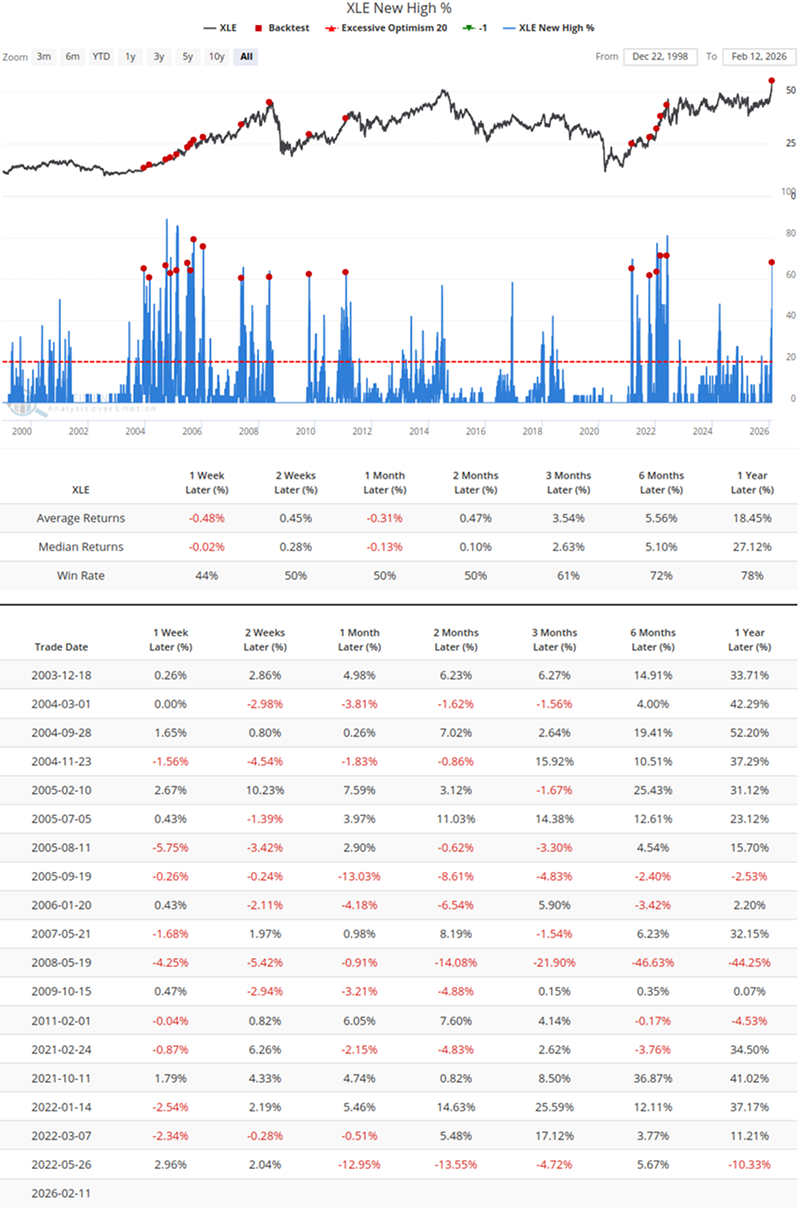
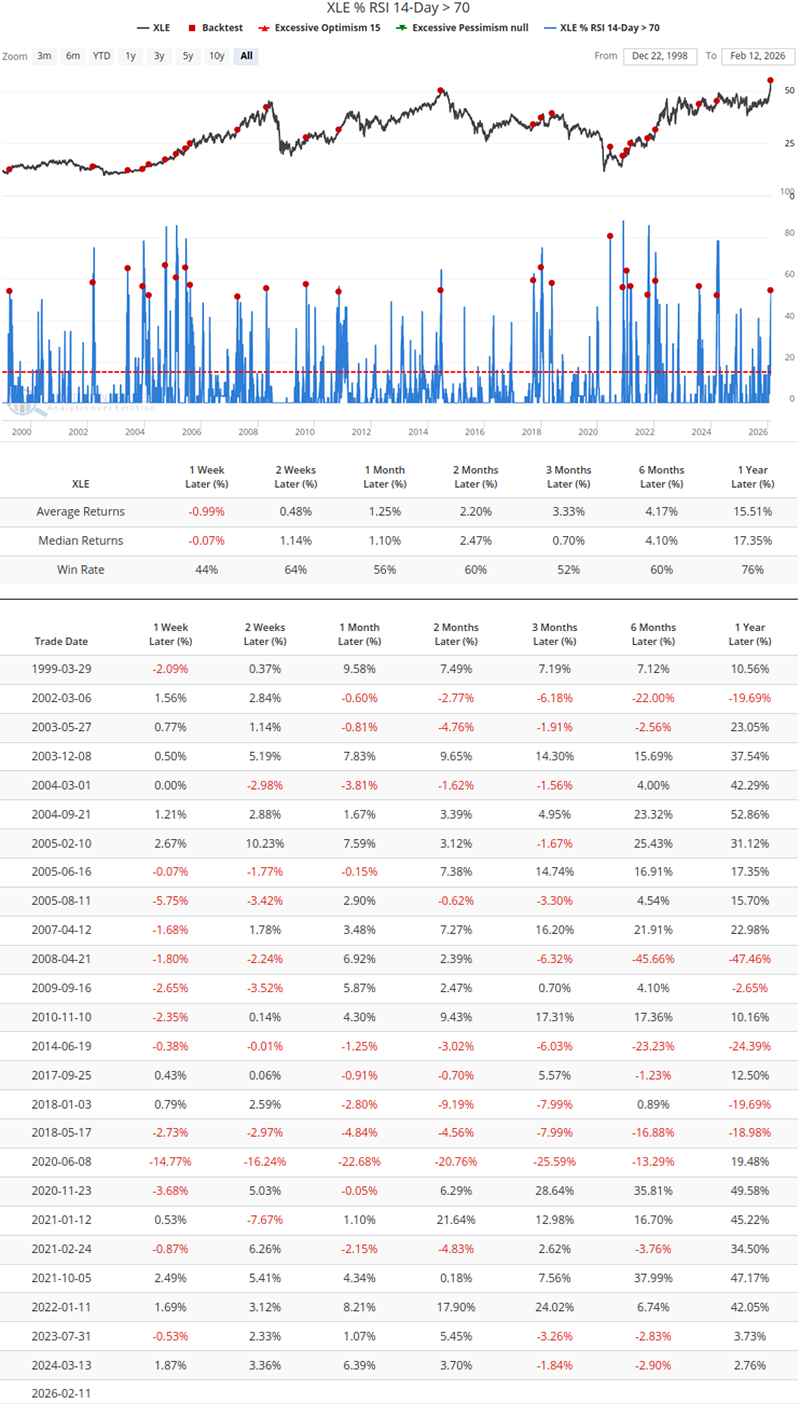
From a long-term perspective, this degree of "overbought" status is often proof of strength. Historical backtests show that when such broad participation occurs, XLE exhibits extremely high win rates (76%-78%) and significant average returns (approximately 15%-18%) in the year following the signal trigger. This suggests the current rally is not driven by just a few heavyweights, but rather by systematic capital inflows across the entire sector; this broad capital base typically supports the sustainability of the trend.
Relative Trend & Seasonal Window
When evaluating the above signals, we must also consider the current time window and relative strength relationships. The Relative Trend Score for XLE has surged to 9.Related Backtest Click Here.
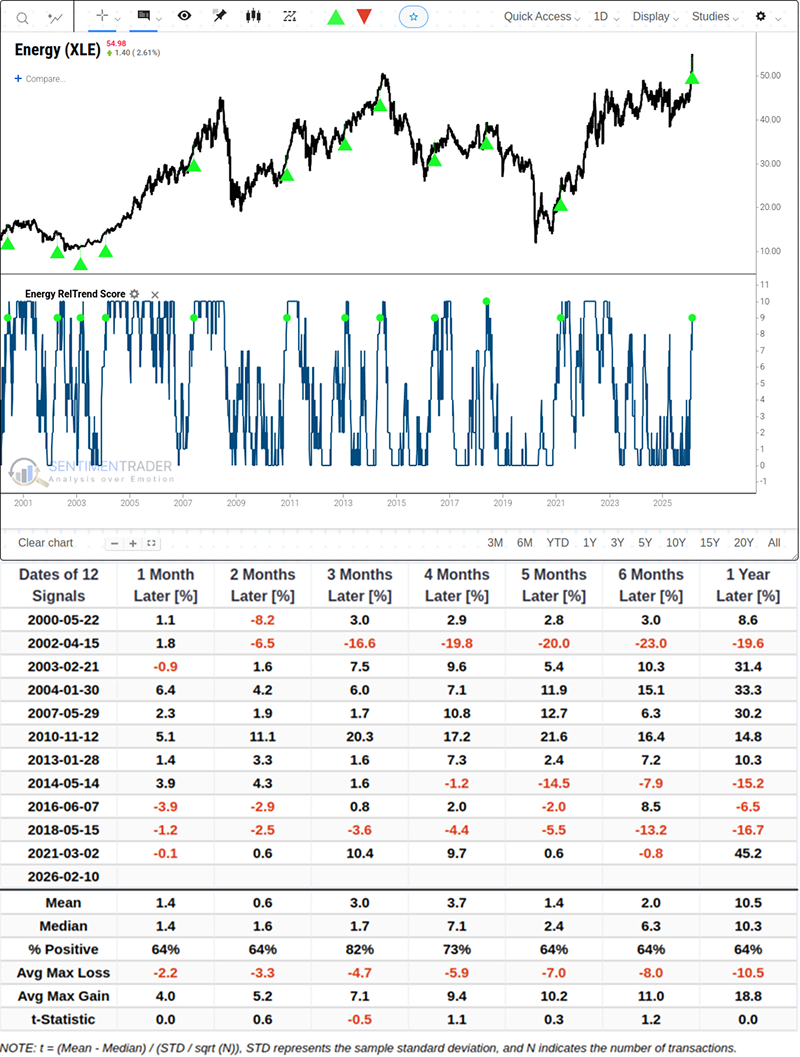
The historical average maximum drawdown for this signal is relatively controllable.
Furthermore, seasonality statistics show that the energy sector typically enters its strongest performance window of the year from mid-February through April.
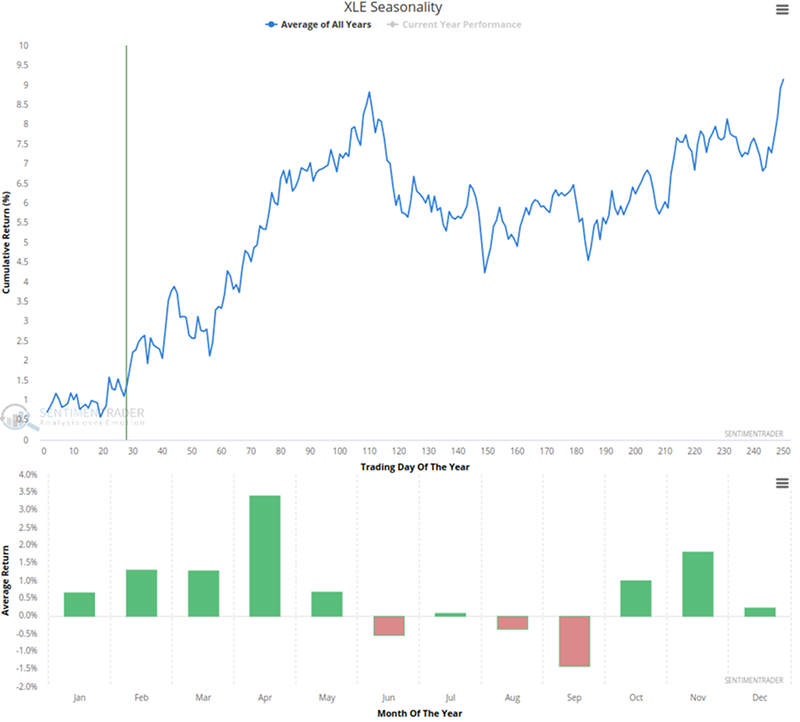
This favorable "timing" factor may buffer the pullback pressure caused by short-term overheated sentiment to some extent, making potential adjustments likely appear more as a consolidation through time rather than a sharp price decline.
What the Research Tells Us ...
On one hand, extreme optimism and moving average divergence suggest the trade is overcrowded, and chasing highs in the short term faces the risk of negative expected value. On the other hand, the breadth thrust and strong relative trend confirm systematic capital intervention, locking in the probability of mid-to-long-term upside.
Historical data does not support blindly chasing the rally at this level, as short-term backtest data mostly points to negative returns or high volatility; however, long-term win rates also negate the rationality of shorting this trend. The above backtests are based on a limited number of similar signals over the past 25 years; sample size is relatively limited, and historical performance does not guarantee future returns. Market participants should remain rational and prioritize risk control.