
Market Breadth Signals and VIX Pulses

Key Points:
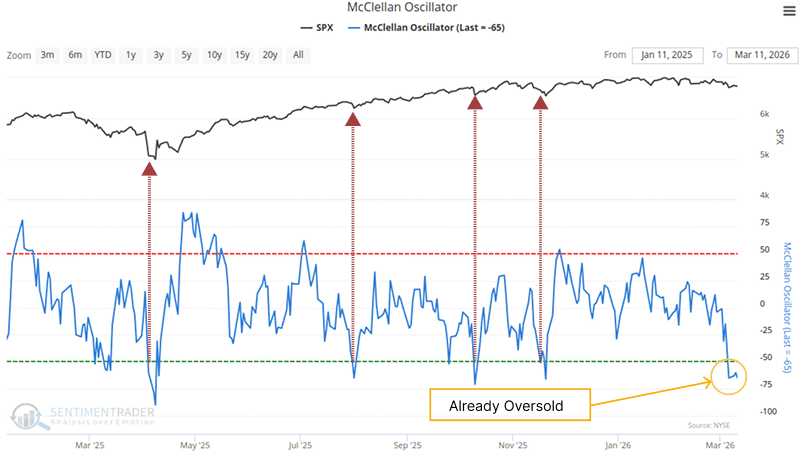
- The McClellan Oscillator has diverged from the S&P 500 Index at its highs
- The VIX Volatility Index has seen a pulsatile surge
- Medium-to-long-term recovery holds probabilistic advantages
Recent Market Observations
The U.S. stock market has recently seemed to enter a zone of heightened friction. Although the broader market remains above the gravitational pull of its long-term moving average, and strong earnings from individual tech giants have barely maintained the index's facade, every upward move in the market has felt unusually arduous and isolated.
The current divergence in the market is no longer merely a rotation of capital, but a reflection of macroeconomic fundamental pressures in microstructures. Most non-tech stocks and small-to-mid-cap stocks, which are vulnerable to high costs and shrinking demand, have already begun a prolonged bearish decline.
Mid-Term Freeze of the McClellan Oscillator
From a quantitative perspective, the market has triggered a signal. After the S&P 500 Index hit an all-time high over a month ago, following days of consolidation and bearish erosion, the McClellan Oscillator-a metric measuring internal market momentum divergence-has finally been dragged into deeply negative territory.
Looking back at 70 historical instances of similar signals since 1963, we can clearly see the harsh odds and capital flows behind this structural reshuffling.Related Backtest Click Here.
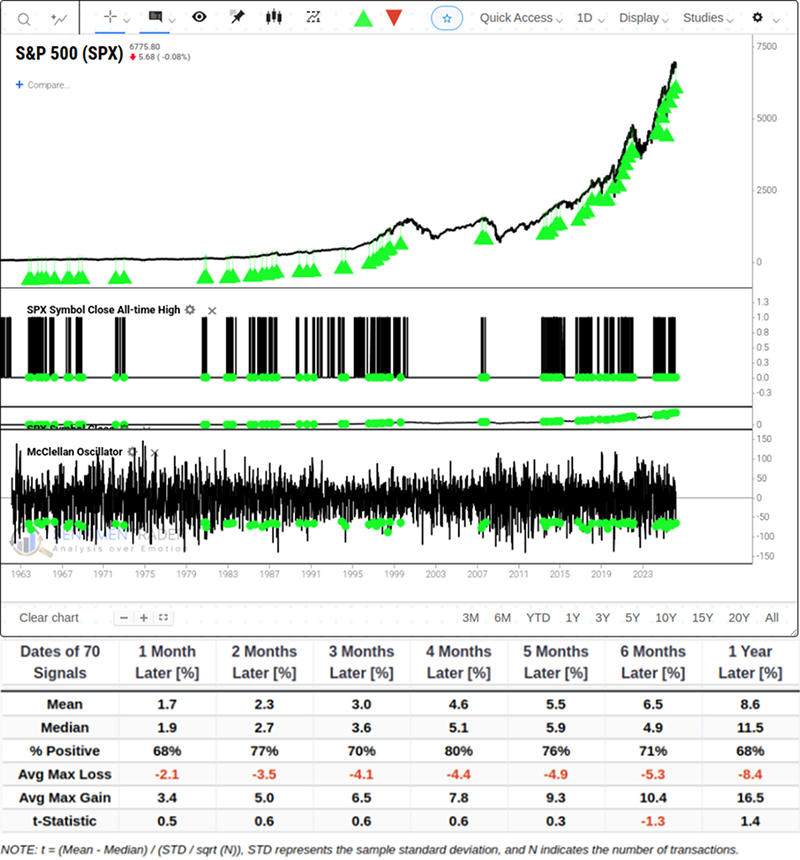
In terms of risk-reward ratios and frictional costs, the market's win rate oscillated between 68% and 77% in the 1 to 3 months following signal triggers, while average maximum drawdowns reached -2.1%, -3.5%, and -4.1% respectively.
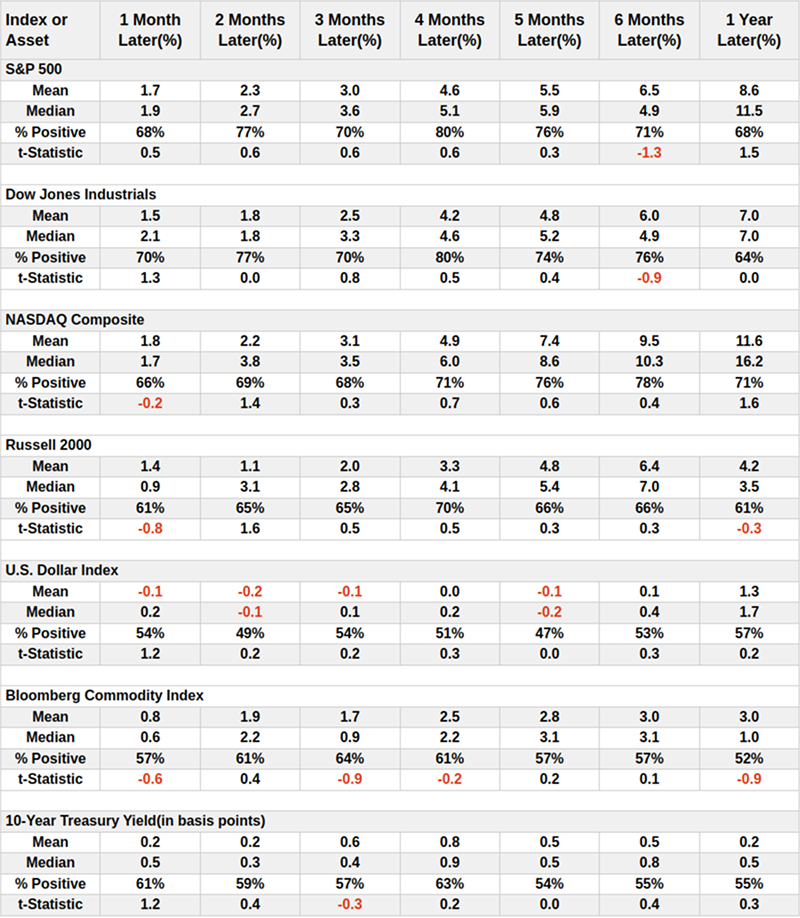
From the perspective of sector rotation and broad asset class data, the Russell 2000 Index (representing small-to-mid-cap stocks) posted a win rate of only 61% in the month after signal triggers, with lackluster average returns.
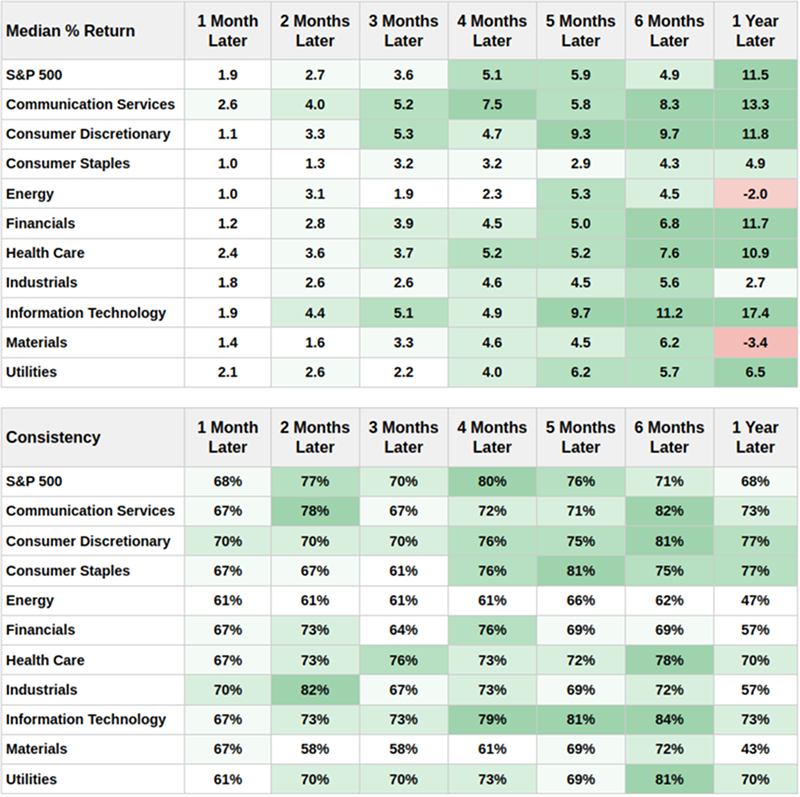
Meanwhile, the Information Technology sector demonstrated a 73% probability of rising after 3 months, with a median return of 11.2% and an 84% win rate half a year later.
VIX Panic Pulse
Resonating with the breadth sentiment freeze is the recent anomaly in the VIX Volatility Index. The VIX saw a sudden pulsatile surge and broke through its stage high in a short period-this abrupt rise in premium is a concentrated defensive pricing of tail risks by capital.
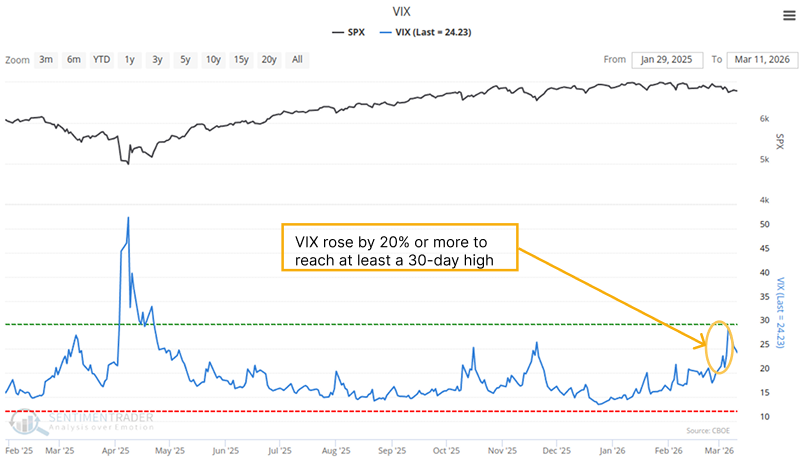
Reviewing backtest data of 89 instances since 1986 where the VIX rose by 20% or more to reach at least a 30-day high, the outbreak of panic typically has a powerful emotional reset effect, but also comes with severe holding tests.Related Backtest Click Here.
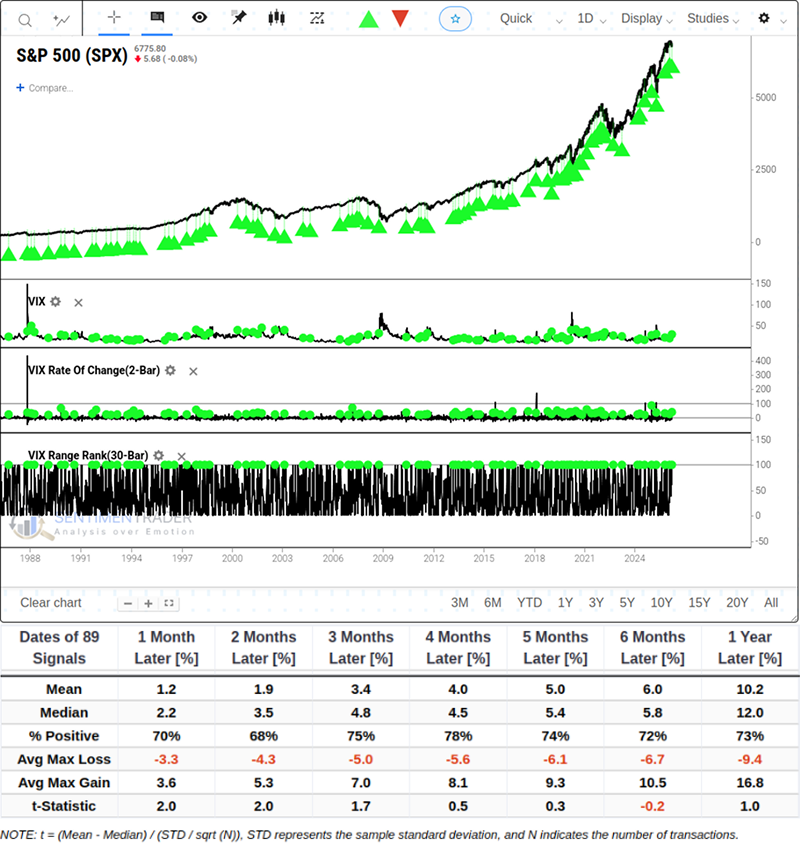
From the perspective of short-term path risk, in the 2 months following signal triggers, the average maximum drawdown and maximum gain were nearly identical. Against the current macro backdrop, aggressively chasing left-side buying points may not yield excess expected returns, and defensive positioning remains the core short-term logic.
From the perspective of establishing medium-to-long-term left-side buying points, short-term VIX pulses rarely permanently alter the slope of long-term moving averages. The probability of rising 3 months and 6 months after a VIX pulse reached as high as 75% and 72% respectively, with average returns of 2.4% and 6.0%.
What the Research Tells Us...
Historical data indicates that after both signals are triggered, the market needs to enter a period of sideways consolidation to digest internal imbalances.
Unlike healthy pullbacks in previous bull markets, the current exhaustion of market breadth is driven by substantive macroeconomic fundamental pressures, rather than transient emotional fluctuations. For traders, avoiding potential downside frictional costs of approximately 4% to 5% in the next 1 to 3 months is more important than blindly pursuing a V-shaped left-side reversal. Only when panic sentiment is exhausted amid volatility and the index remains above its long-term moving average will the true certainty of medium-to-long-term win rates emerge.
However, historical backtest data is only a snapshot of probabilities and cannot perfectly replicate reality. The current market is in a sensitive overlap period of non-linear geopolitical disruptions and inflection points in macroeconomic data, leading to significant uncertainty in future trends. This article only presents indicator conditions and deductions, and is not investment or trading advice. Please be sure to conduct a prudent assessment based on your own risk tolerance and the latest macroeconomic fundamentals.