Market Breadth Composite Rank Update

The S&P 500 Index closed at a new all-time high on Monday and Thursday. Whenever an Index registers a new high, I always like to assess the market's internal condition to see if the troops are participating.
Let's review how the new all-time highs compare to history as measured by a market breadth composite.
MARKET BREADTH COMPOSITE COMPONENTS
The composite includes the following:
- Percentage of issues above the 10-day moving average
- Percentage of issues above the 50-day moving average
- Percentage of issues above the 200-day moving average
- Percentage Spread Between 21-Day Highs and Lows
- Percentage Spread Between 63-Day Highs and Lows
- Percentage Spread Between 252-Day Highs and Lows
The individual component values are summed and divided by six to arrive at a single composite value. Composite values can turn negative during corrections and bear markets as new lows overwhelm new highs in the spread calculation.
MARKET BREADTH COMPOSITE STUDY
I first identified every single all-time closing high in the S&P 500 Index since 1928. According to my calculation, there are 1,300 instances. I then ranked each breadth composite value on the day of the all-time closing high. Rankings range from 100 (strongest) to 0 (weakest). By ranking each all-time high, I can now make an apples-to-apple comparison throughout history.
I conducted the same study for the S&P 1500 with data starting in 1963.
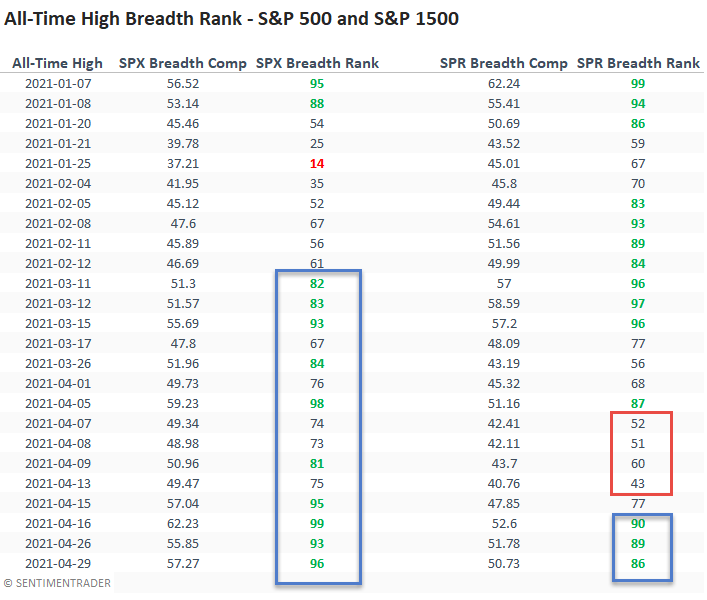
MARKET BREADTH COMPOSITE TABLE
Large-cap breadth has been nothing short of spectacular for the last few months, especially in April. The breadth composite rank registered one of the highest readings since 1928, with a level in the 99th percentile on 4/16/21. After a soft patch in the first part of April, the S&P 1500 rankings have regained momentum with solid readings this week.