
Making the most of the year-end rally

Key points
- The last portion of the year tends to be favorable for stocks into the new year
- A simple combination of factors has demonstrated a highly consistent performance over the past 70 decades
- We detail the history below
Defining the "year-end rally" period
The period we will consider here:
- Starts at the close of Trading Day of the Year #244
- Ends at the close of the first trading day of the following year
For 2024-25, this period extends from the close on 2024-12-18 through 2025-01-02.
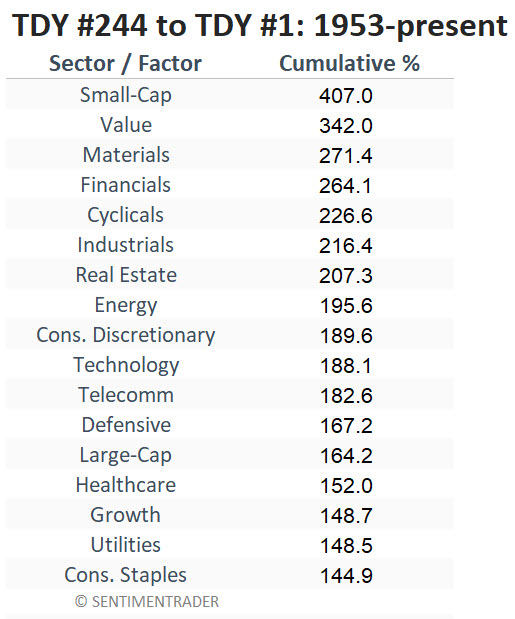
The table below displays the cumulative hypothetical growth of $1 invested in each of the eleven S&P 500 sectors and six S&P 500 factors only during this period starting in December 1953.
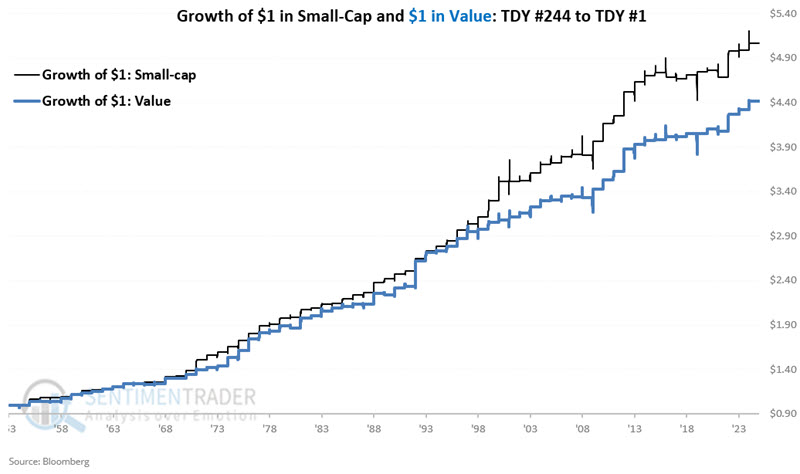
The chart below displays the hypothetical cumulative growth of $1 invested in Small-cap and Value factors during this year-end period every year since 1953.
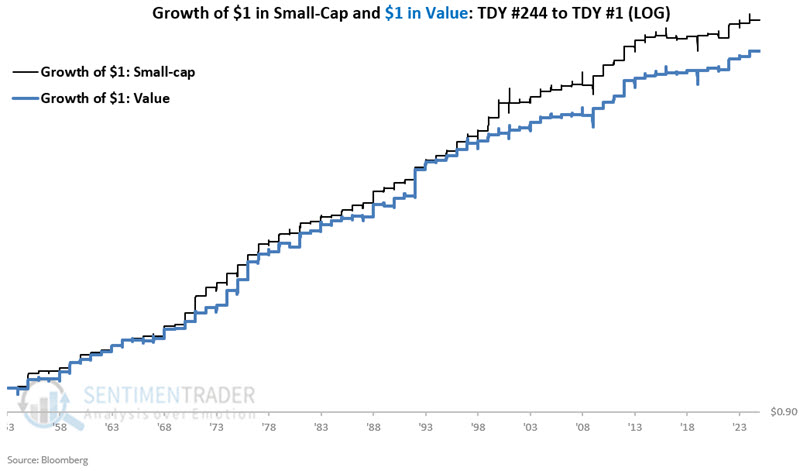
The table below displays the same results on a logarithmic scale.
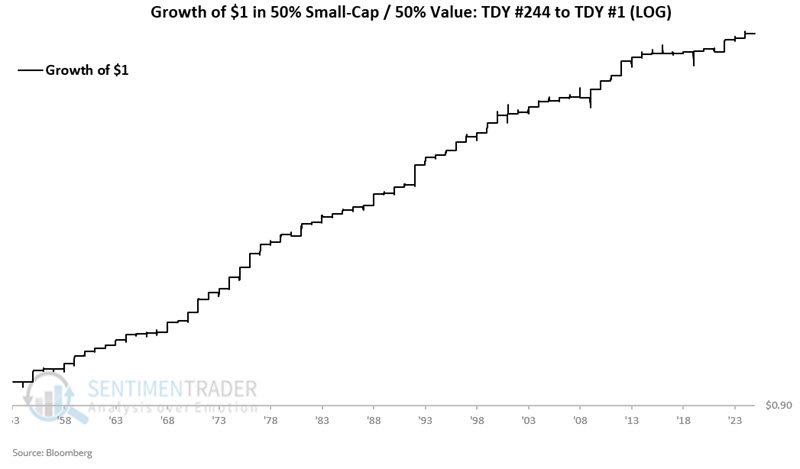
Let's consider a strategy that evenly divides capital between Small-cap and Value indexes only during this favorable year-end period. The chart below displays the cumulative hypothetical growth of $1 split evenly each year between Small-cap and Value during the TDY #244 through TDY #1 period.
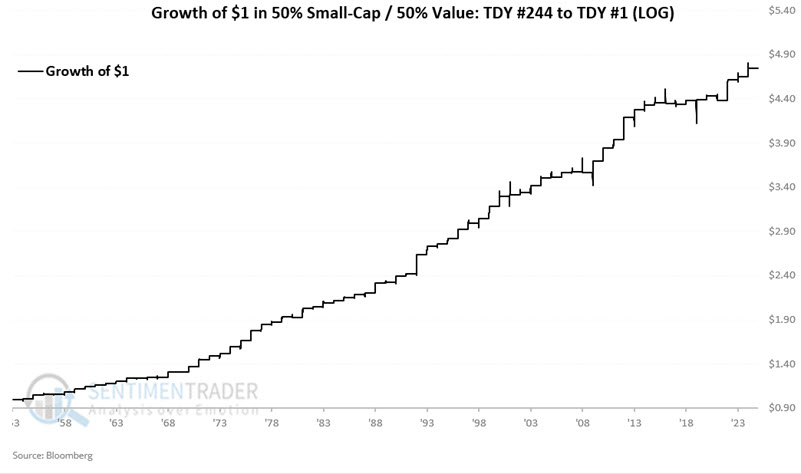
The table below displays the same results on a logarithmic scale.
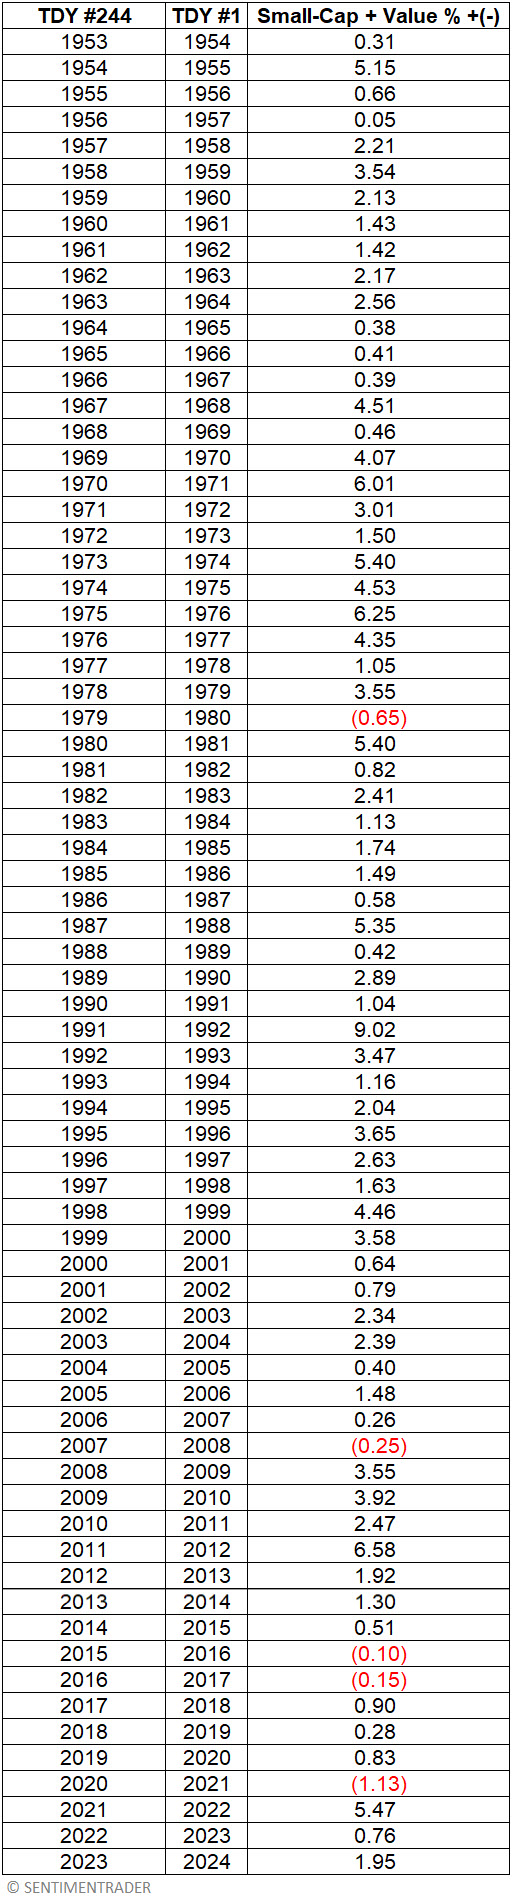
The table below displays year-by-year hypothetical results.
The table below summarizes annual results.
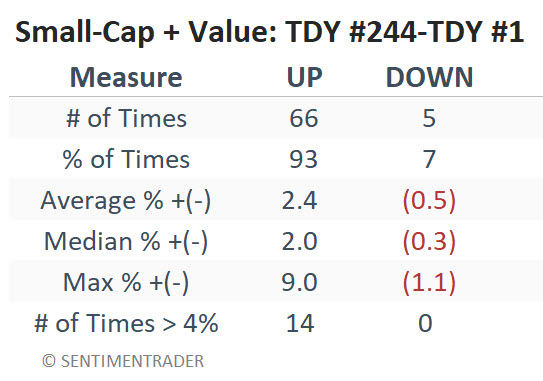
There is a lot to like regarding the figures in the table above: a win rate of 93%, a median gain of +2.0% versus a median loss of -0.3%, and a maximum loss of just -1.1%. Likewise, returns more than 4% skew to the positive side by a factor of 14-to-0.
ETFs for tracking these factors
The ETFs listed below are designed to track the indexes used in the tests above:
- The iShares Core S&P Small-Cap ETF (ticker IJR) tracks the S&P 600 Small-Cap Index
- The SPDR Portfolio S&P 500 Value ETF (ticker SPYV) tracks the S&P 500 Value Index
Both can be used to emulate the strategy highlighted above.
What the research tells us…
The good news is that the small-cap and value factors have tended to perform well during this year-end period. The bad news is that there is no guarantee that things will follow suit in 2024. The limitation of this kind of analysis and trading is that you only get "one bite of the apple" yearly. While a 93% win rate and a maximum previous loss of -1.1% is compelling, the adage "past performance is no guarantee of future results" is 100% applicable here.