
Macro Index Expands

Key points
- The Macro Index Model (MIM), which aggregates 11 key economic indicators, has expanded further, crossing back above the 0.7 threshold.
- Historically, when the MIM cycles from recessionary levels (<= 0.5) to expansionary levels (> 0.7), the S&P 500 has typically seen further upside in the following weeks.
- Conversely, this same macro improvement has historically been a headwind for Gold and the US Dollar, which tend to underperform random returns over the subsequent year.
- While historical data suggests caution for Gold, strong geopolitical tailwinds and central bank buying may decouple it from traditional macro correlations.
The Macro Index Model
The U.S. economy's improvement is evident in our Macro Index, which uses 11 indicators to judge the state of the U.S. economy right now. This index is normally quite effective at giving advance warning for major bear market declines. A previous report noted that the Macro Index broke above 0.6 in December, signaling positive medium-term prospects for the S&P 500. This month, the macro index continued to expand, returning above 0.7.
Our Macro Index Model (MIM) combines 11 various economic indicators to determine the state of the U.S. economy right now. Including:
- New Home Sales
- Housing Starts
- Building Permits
- Initial Claims
- Continued Claims
- Heavy Truck Sales
- 10-year - 3-month Treasury yield curve
- S&P 500 vs. its 10-month moving average
- ISM manufacturing PMI
- Margin debt
- Year-over-year headline inflation
The model is constructed as an inverse of recession probability. So, you can subtract the model from 100% to get the recession probability in the months ahead. A model reading of 70% suggests a 30% recession probability; a reading of 20% suggests an 80% recession probability.
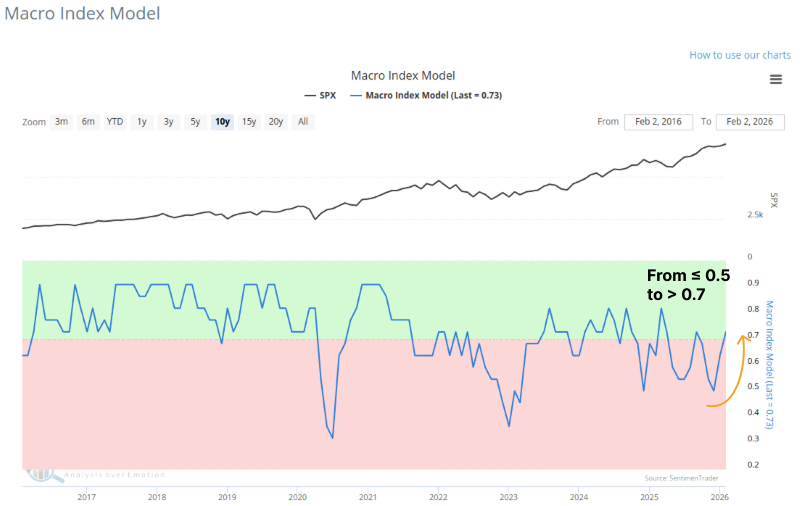
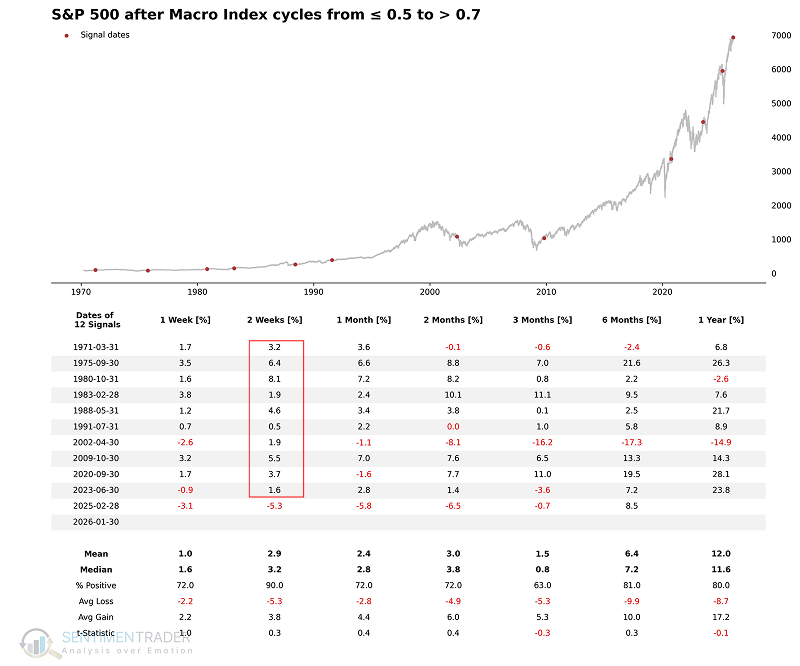
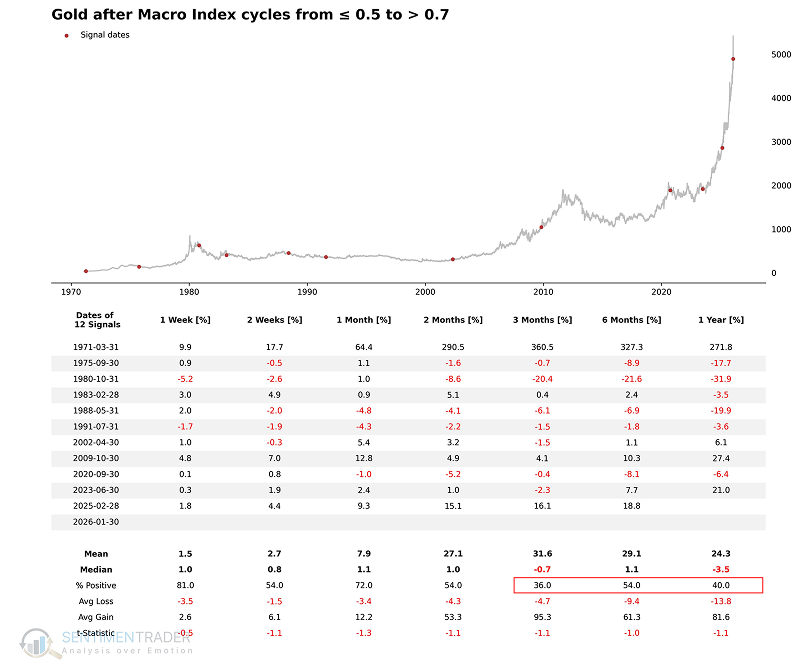
Returns were robust when the model was above 50%, and significantly subpar when it was 50% or below. The chart below highlights the dates when the MIM recovered from <= 0.5 (recession territory) to 0.7.
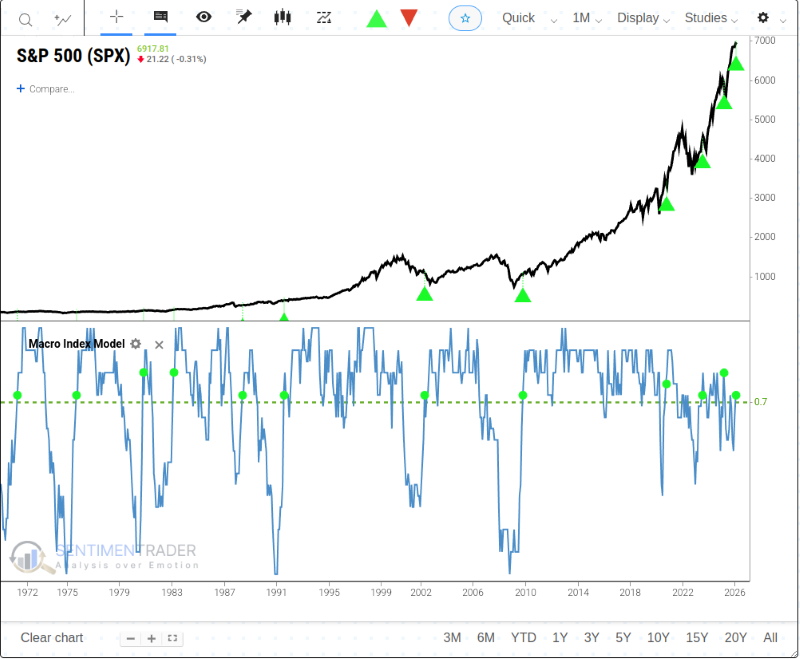
When the Macro Index recovers from recessionary levels (<= 0.5) to 0.7, the S&P 500 typically has room for further rebounds in the coming weeks. Excluding the market turbulence triggered by the sudden shift in trade policy early last year, this signal maintained a perfect win rate over a two-week timeframe.
How about other assets?
Last month, precious metals prices surged, driven by speculative fervor, geopolitical turmoil, and concerns over Federal Reserve independence. That rally came to an abrupt halt last weekend. As of the evening of February 3rd, gold prices rebounded to over $5,000 per ounce after plunging from record highs. The chart and table below show the performance of gold when the MIM recovers from <= 0.5 to 0.7. For related backtest, click here.
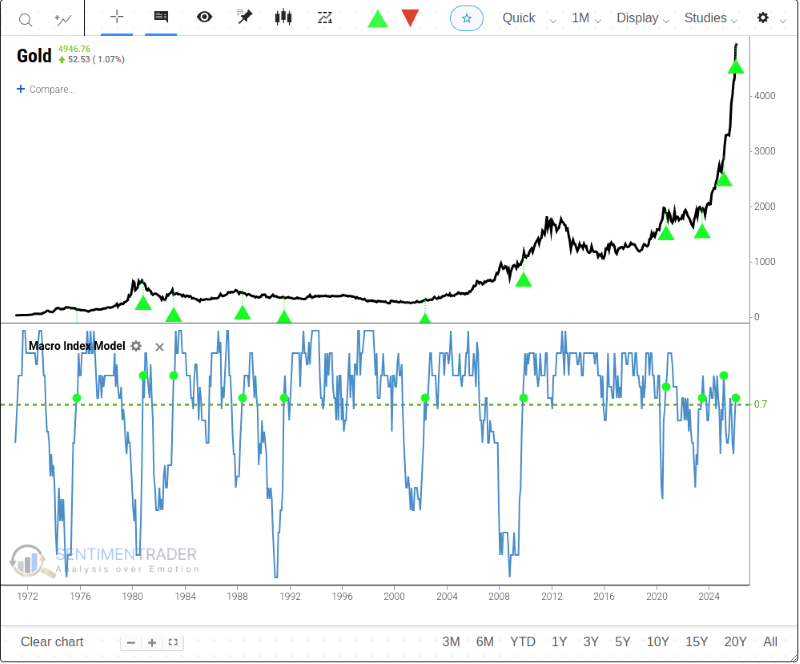
Based on historical backtests, gold's returns over the subsequent year following this signal have been worse than random. However, we must be wary of the risk that indicators may fail. In recent years, driven by factors such as geopolitical tensions and strategic hoarding by central banks, gold's price action has decoupled from traditional oscillators. Strong safe-haven demand and momentum currently dominate the market, so one should not be mechanically bearish. Trend models still show precious metals in a solid uptrend. Investors need to be alert to continued high price volatility in precious metals.
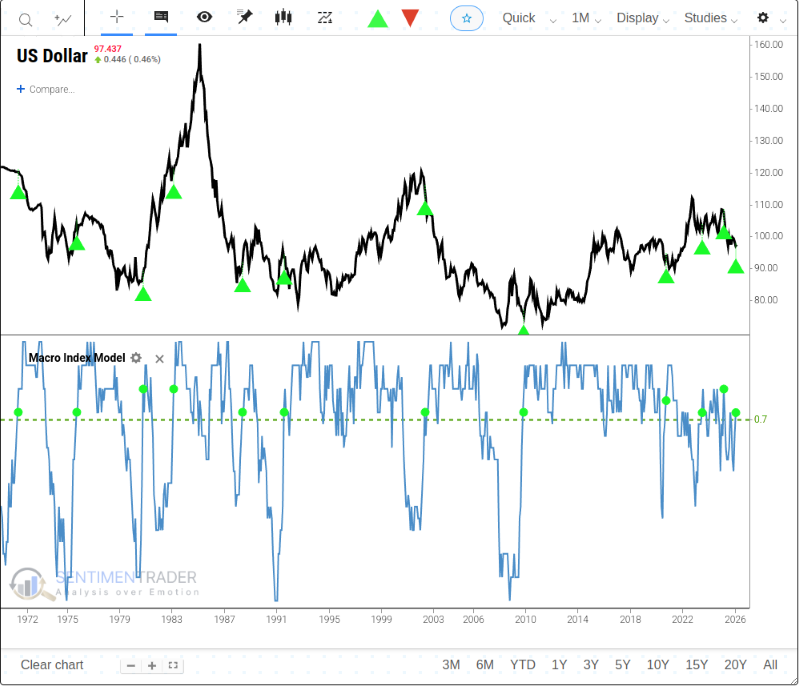
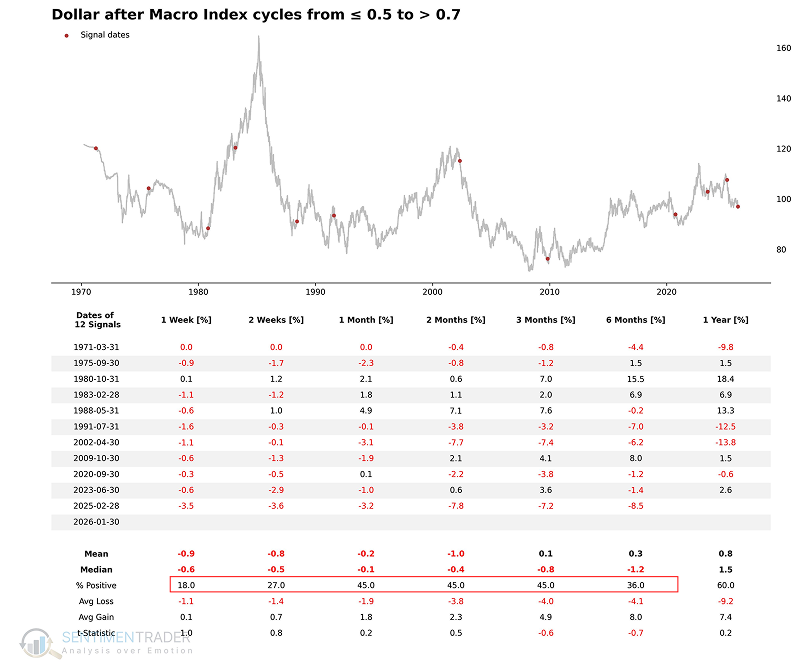
The US Dollar Index also tended to generate below-average returns in the following months.
How can I recreate this signal in the Backtest Engine?
Complete the following tasks in the Entry Criteria section:
- Select TimeOrder Multi-Condition in the top right-hand corner
- In the Indicator search box, type Macro Index Model and select the indicator
- In the Indicator Value dropdown, select "<" and enter 0.51.
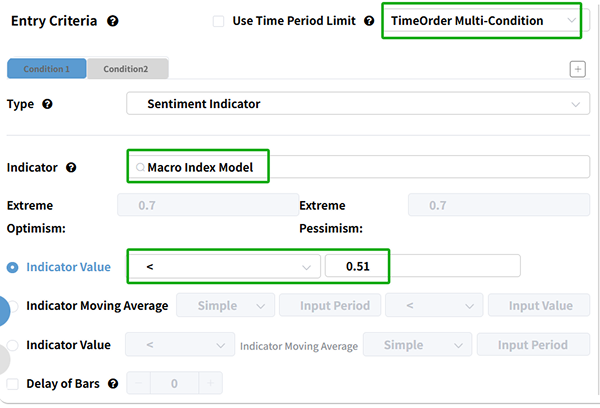
Click on the Condition2 tab and complete steps 2 from above. However, this time, select CrossAbove and enter 0.7.
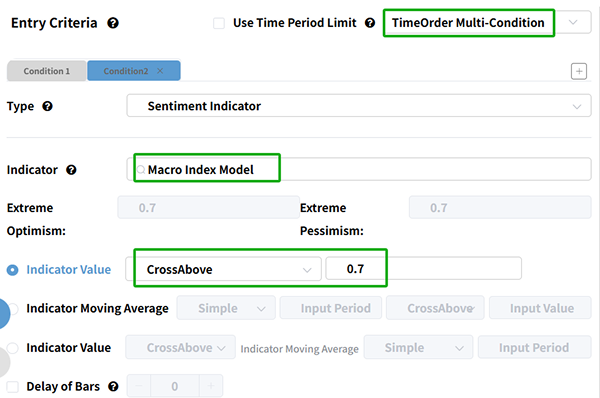
Then change the Time In Market from 21 to 1. Since MIM is a monthly indicator, 21 bars represent 21 months, which may cause us to miss valuable signals.

Finally, click on the Run Backtest button.
What the research tells us...
The Macro Index Model (MIM) has continued its expansion, crossing the 0.7 mark, which further confirms the resilience of the U.S. economy and a reduced probability of near-term recession. Historically, this shift from contractionary to expansionary readings has been a reliable tailwind for the S&P 500. However, this same economic normalization tends to act as a headwind for defensive and counter-cyclical assets like Gold and the US Dollar. While the macro signal suggests caution for precious metals, the unique current environment of geopolitical instability may override historical precedents, warranting a flexible approach.