
Macro conditions are on the edge of ugliness

Key points:
- The Macro Index Model is currently suggesting a low probability of an imminent recession
- However, it is fading fast, and even a slight decline from here has coincided with poor stock returns
- The best scenario for investors would be a sudden and broad improvement in macro data
Macro condition deterioration
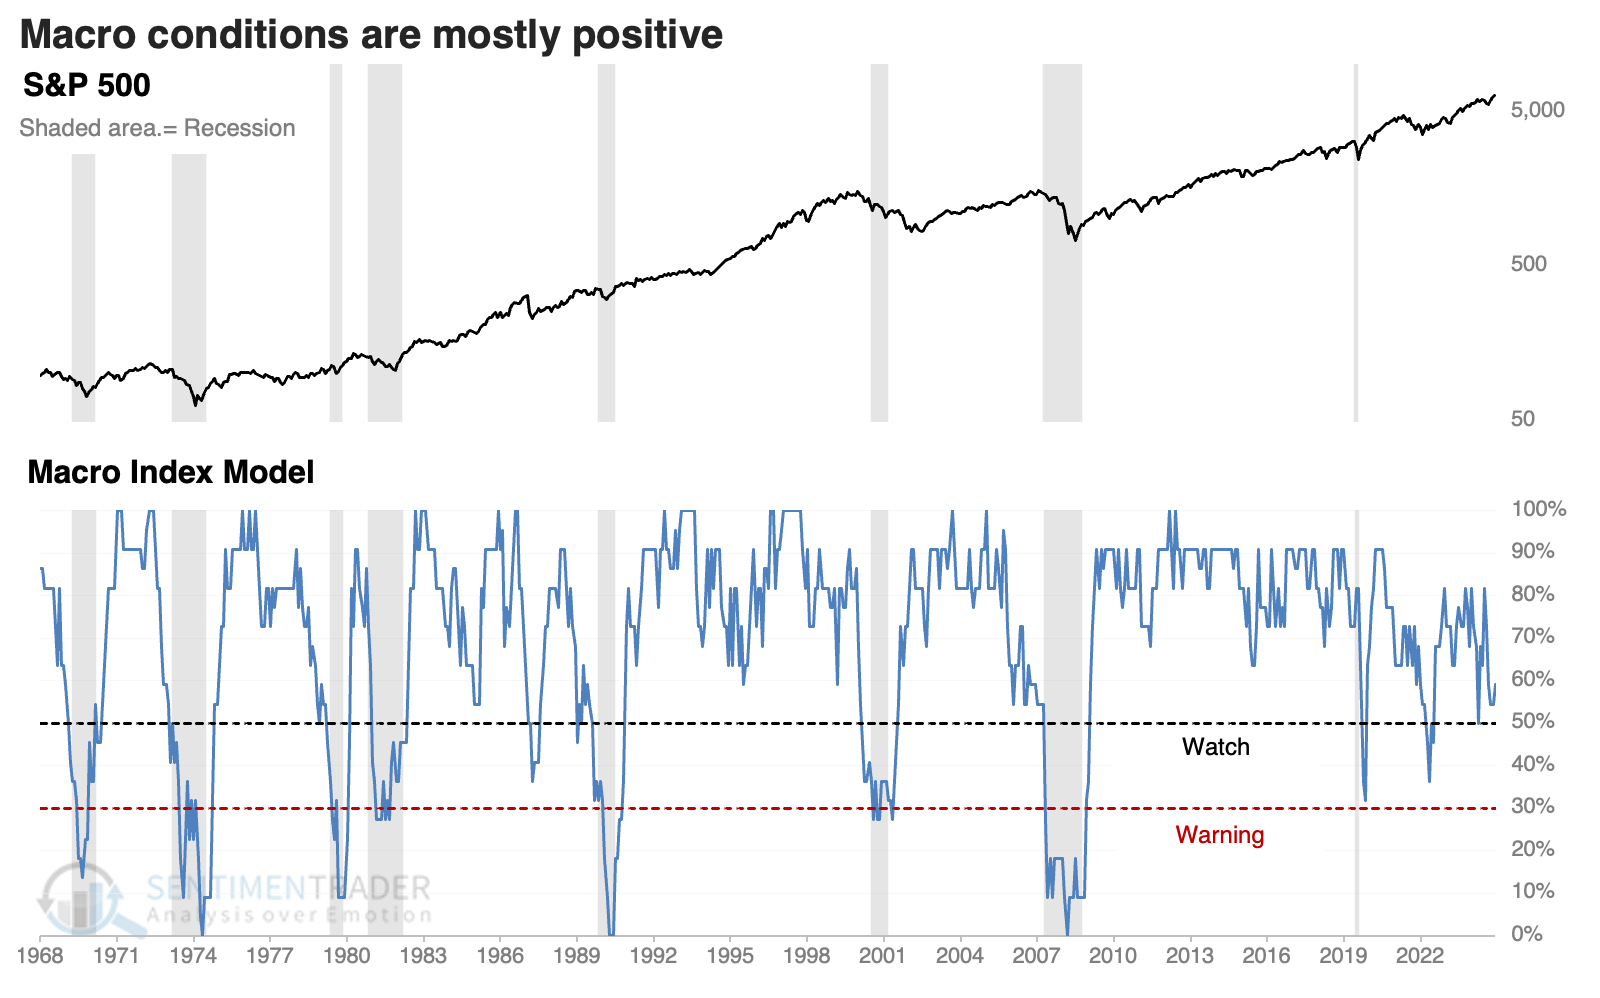
Macro conditions in the U.S. are okay. But they're not great, and the Macro Index Model suggests they're in imminent danger of eroding to unhealthy levels.
Any model based on economic reports has two main challenges: 1) delayed reporting, and 2) revisions. Some U.S. data series are heavily revised months after release, which doesn't help us if we're trying to use a model in real time. To address those issues, we only update the model monthly and use originally-reported (not revised) data.
We look for significant macro deterioration to differentiate temporary slowdowns from real problems. Our Macro Index Model combines 11 diverse economic indicators to determine the state of the U.S. economy:
- New Home Sales
- Housing Starts
- Building Permits
- Initial Claims
- Continued Claims
- Heavy Truck Sales
- 10 year - 3 month Treasury yield curve
- S&P 500 vs. its 10-month moving average
- ISM manufacturing PMI
- Margin debt
- Year-over-year headline inflation
The model is constructed as an inverse of recession probability. So, you can subtract the model from 100% to get the recession probability in the months ahead. A model reading of 70% suggests a 30% recession probability; a reading of 20% suggests an 80% recession probability.
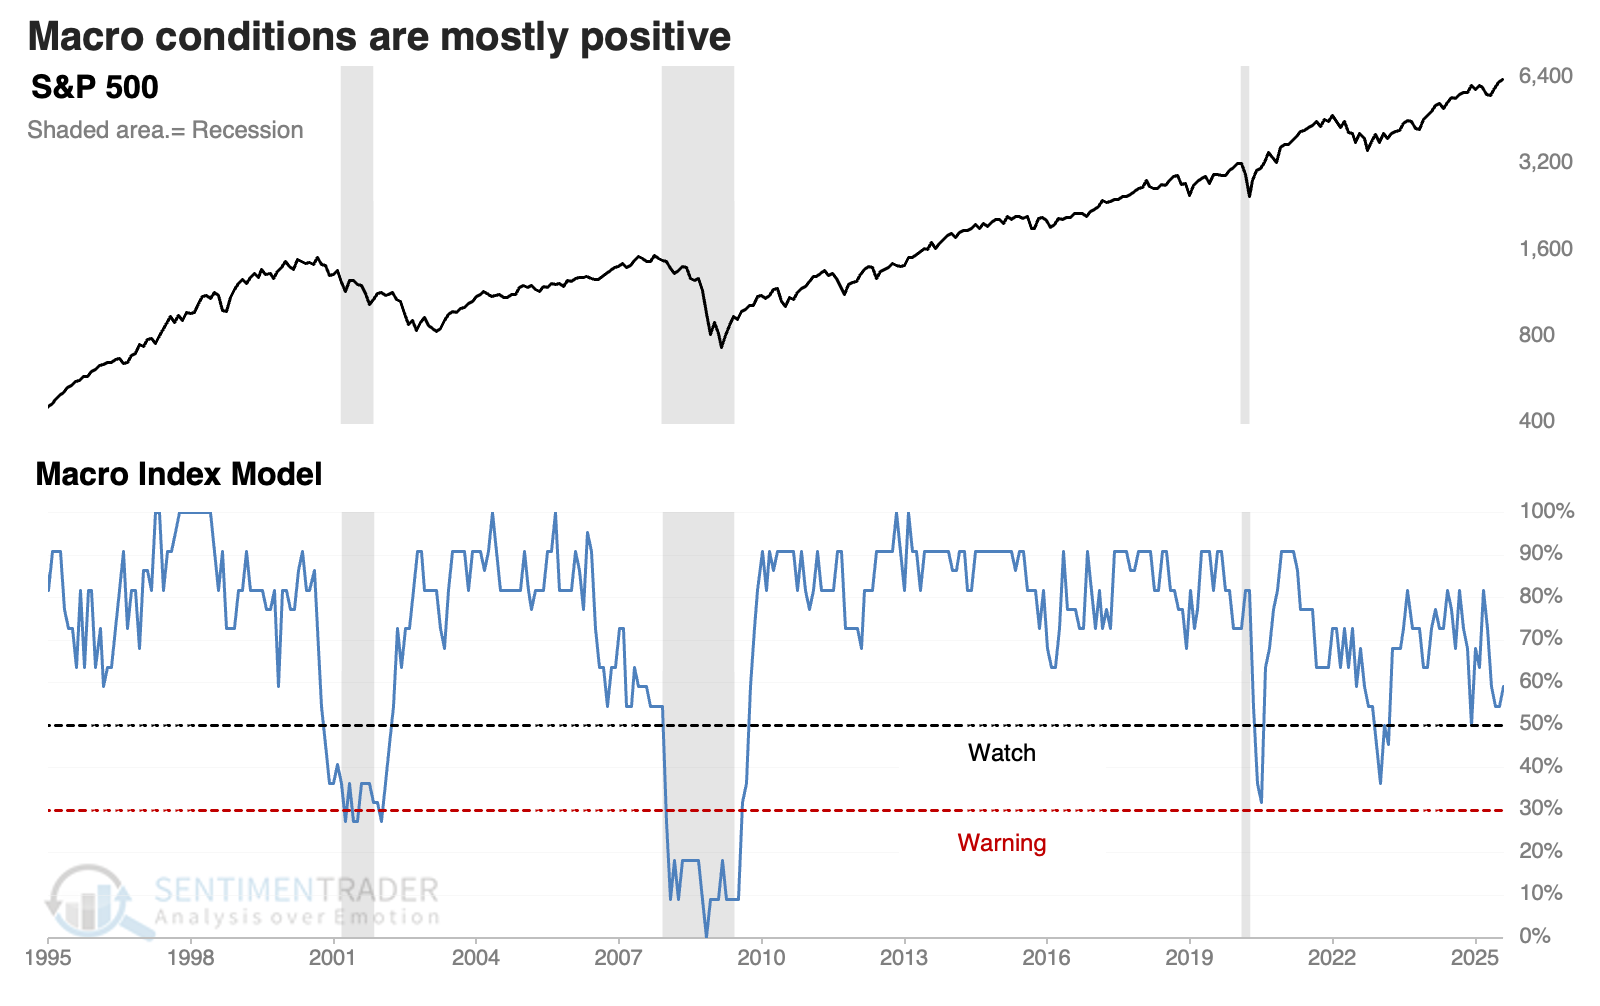
IMPORTANT NOTE: The chart currently on the website is incorrect. We have discovered some inconsistencies with the scripts that run the model, and the team is working on correcting them.
Zooming in, we can see that the past five years have been difficult for the model. Most government economic data are released with a delay, so by the time they reflected the pandemic shutdowns, the recession was already over. In 2022, the data briefly showed more than a 50% recession probability, but the economy shrugged it off.
Probability of recession and poor returns
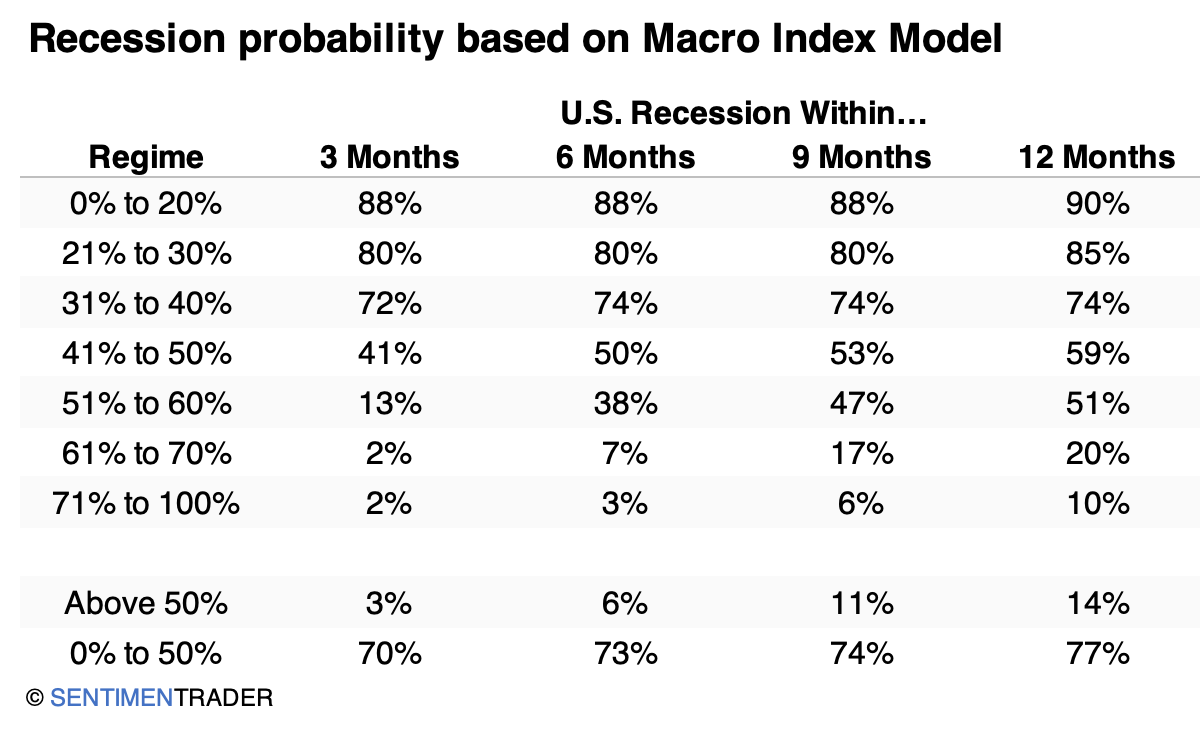
The probability of the U.S. being in recession varies greatly depending on the reading of the Macro Index Model. Below, we can see how often there was a recession as defined by the National Bureau of Economic Research over various time frames, depending on the model reading.
When the model was 20% or below, there was an 88% chance of recession within three months; there was only a 2% chance if the model was above 70%.
To keep it simple, a good cutoff was 50%. If the model was above 50%, there was only a modest 6% probability of a recession within the next six months, but a 73% probability if it was 50% or below.
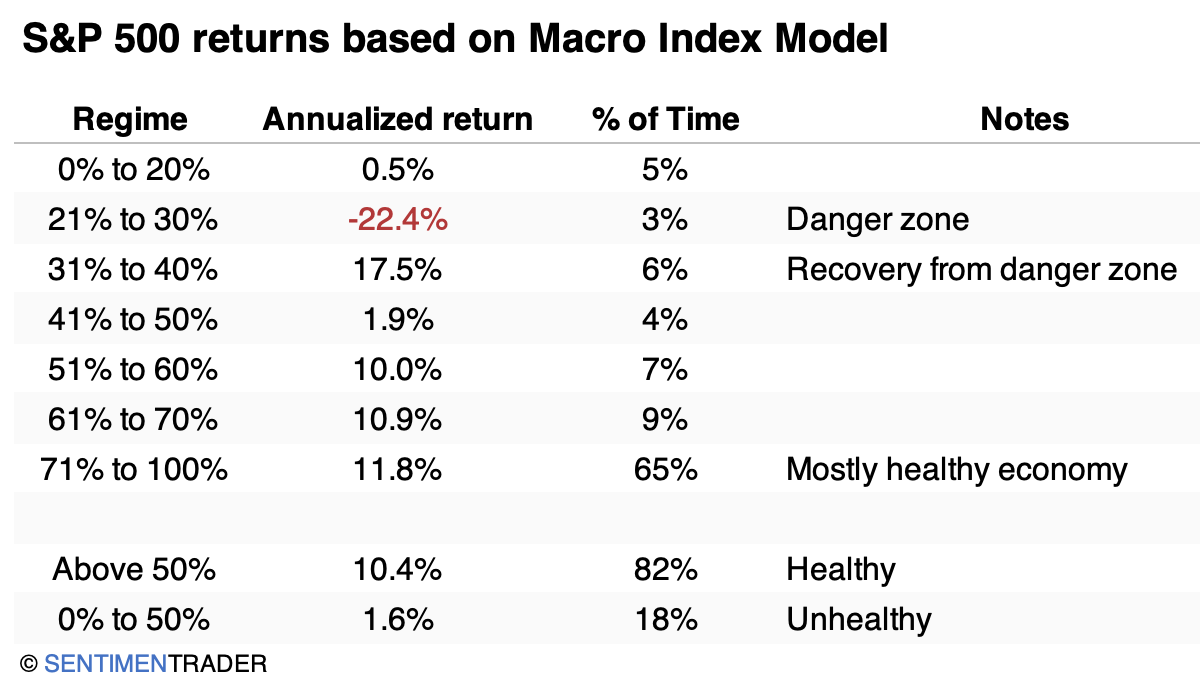
Most investors are just as concerned with stock returns, and we can see that those also vary greatly. The worst regime - the danger zone - was between 21% and 30%. These were the months when the economy was almost certainly in recession, but hadn't been long enough for conditions to be washed out.
The best regime for average returns was just above that, from 31% to 40%. That's because stocks often surged when coming out of a recession, which is what that threshold captured. The next-best was when the model was above 70%, when most economic indicators suggested an economy chugging along.
Again, to keep it simple, returns were robust when the model was above 50%, and terribly subpar when it was 50% or below.
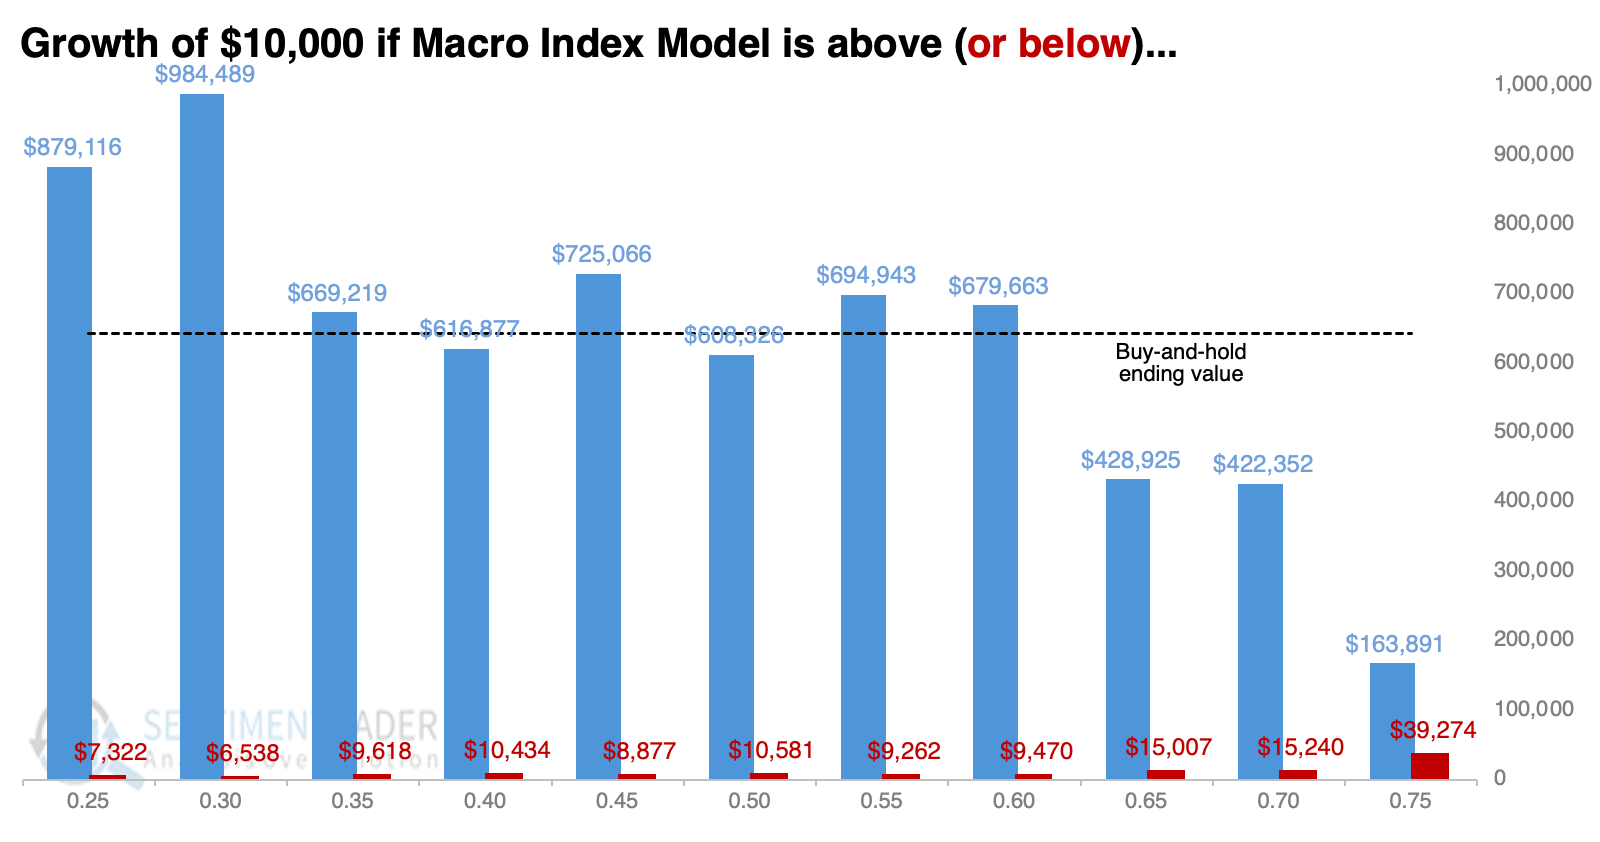
The chart below shows the ending value of $10,000 invested in the S&P 500 depending on the prior month's reading of the model.
The sweet spot was 30%. As long as the model was above that level, the S&P turned $10,000 into nearly $1,000,000, which is well above the return by just buying and holding the index. Even better, the maximum drawdown was 31%, compared to 48% for buy-and-hold using monthly closing values.
While only investing when the model was above 70% limited drawdowns, it also limited the amount of time an investor had money in stocks to enjoy the power of compounding.
What the research tells us...
The Macro Index Model is a bit worrisome as of the end of July (which includes economic data primarily from June due to reporting delays). When it is within this general vicinity, there is a greater-than-even chance the U.S. would fall into recession within a year. The S&P 500's average returns have been acceptable when the model was between 51% and 60%, but they drop off dramatically when the model drops below 50%, which wouldn't take much from here.