
M2? Who knew?

Key points
- It is said that "money moves the market"
- Real M2 offers a useful way to track the trend in the size of the money supply
- In this piece, we look to use this information as a stock market indicator
Why M2 matters (in theory)
One old adage about the stock market states, "Money moves the market." On a theoretical level, this is hard to argue against. When money is pouring into stocks, the rising demand tends to push stock prices higher. Conversely, when buyers go on strike and less money comes into the market, stock prices tend to be weaker. So, how do we measure the trend of "money?" One well-known measure is M2.
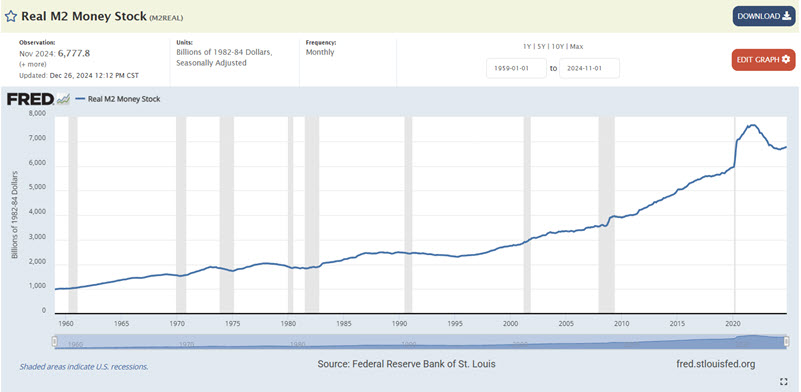
M2 is the U.S. Federal Reserve's estimate of the total money supply, including all the cash people have on hand, plus all the money deposited in checking accounts, savings accounts, and other short-term saving vehicles such as certificates of deposit (CDs). Retirement account balances and time deposits above $100,000 are omitted from M2.
For our purposes, we will use "Real M2", which is M2 deflated by inflation.
This series deflates M2 money stock (https://fred.stlouisfed.org/series/M2SL) with CPI (https://fred.stlouisfed.org/series/CPIAUCSL).
The Real M2 data series can be found at FRED here.
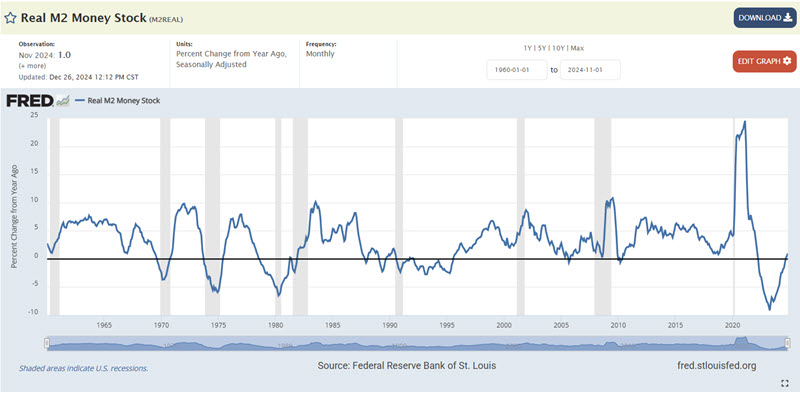
The most relevant question regarding the money supply is, "How fast is it growing or shrinking?" To answer this question, we look at the 12-month percentage rate of change in Real M2. This series is reflected in the chart below. The data can be found here.
A note regarding when to analyze the data: The M2-related data for the previous month typically comes out sometime late in the current month. We interpret the data at the end of the current month using the latest available values. For example, the November 2024 value for Real M2 Money Stock was reported on 2024-12-26. We would analyze this data at the end of December 2024 and apply whatever determination was made beginning on the first day of January 2025.
The rate-of-change of the rate-of-change offers a clue
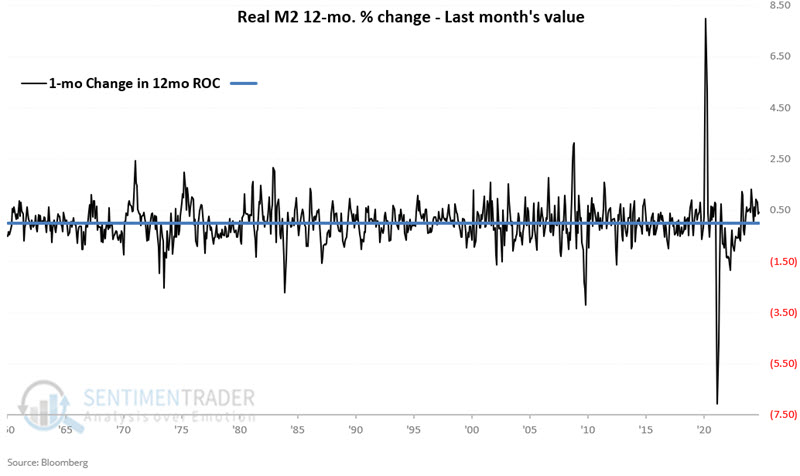
On the last day of the current month, we can compare the latest value for Real M2 Money Stock to the value of 12 months ago to arrive at the 12-month rate-of-change, as detailed above. From there, we take one additional step to:
- Compare the 12-month rate-of-change for this month to the 12-month rate of change calculated last month to see if there has been an increase or a decrease
In longhand, we measure the one-month change in the 12-month change in Real M2 (are we having fun yet?). This data series can be volatile, as reflected in the chart below.
So, to summarize:
- A = Latest available Real M2 Money Stock value at the end of the month
- B = Real M2 Money Stock value 12 months ago
- C = ((A / B) -1) *100 (12-month rate of change in Real M2)
- D = C - value for C last month (1-month change in Value C)
As it turns out, the interpretation is pretty straightforward:
- If D is above zero, then the money supply is rising (that is deemed favorable for stocks)
- If D is below zero, then the money supply is falling (that is deemed unfavorable for stocks)
Note that Variable D has been continuously positive since the end of October 2023.
Analyzing the results
At the end of each month, we calculate Variable D above and apply the following rules:
- If D is greater than zero, then we consider the next month as "favorable" for stocks
- If D is less than or equal to, then we consider the next month as "unfavorable" for stocks
The chart below displays the hypothetical growth of $1 invested in SPX only during favorable months, starting 1960-12-31. $1 invested only during favorable months grew to $36.51.
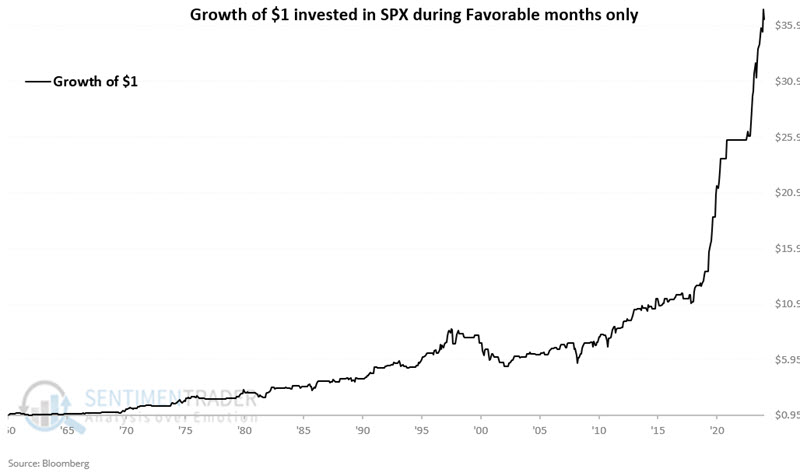
The chart below displays the same results on a logarithmic scale.
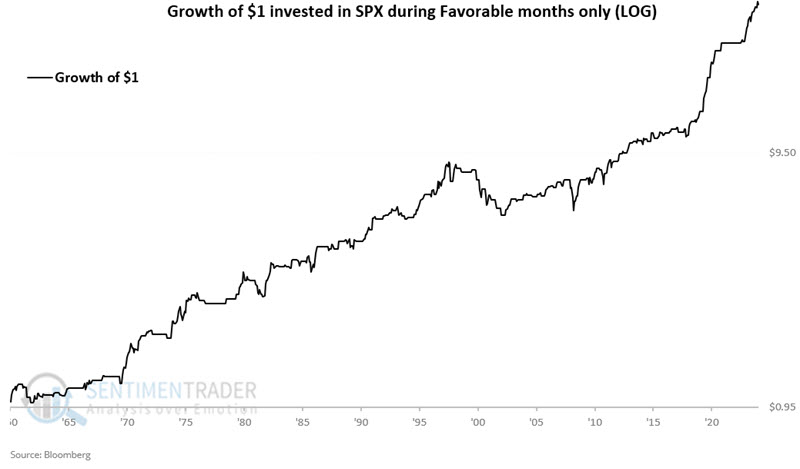
The equity curve above suffered a significant drawdown during the 2000-2002 bear market. Outside that period, it showed a strong "Lower left to upper right" tendency from the early 1960s to the late 1990s and from 2002 until now. This suggests it is a potentially useful "weight of the evidence" indicator.
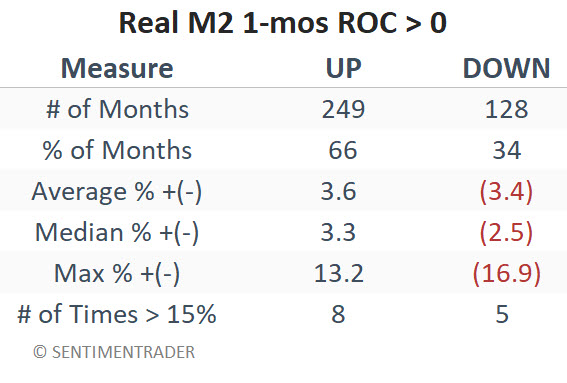
The table below summarizes performance during favorable months.
Now, let's look at unfavorable months.
The chart below displays the hypothetical growth of $1 invested in SPX only during unfavorable months, starting 1960-12-31. $1 invested only during favorable months grew to $2.77.
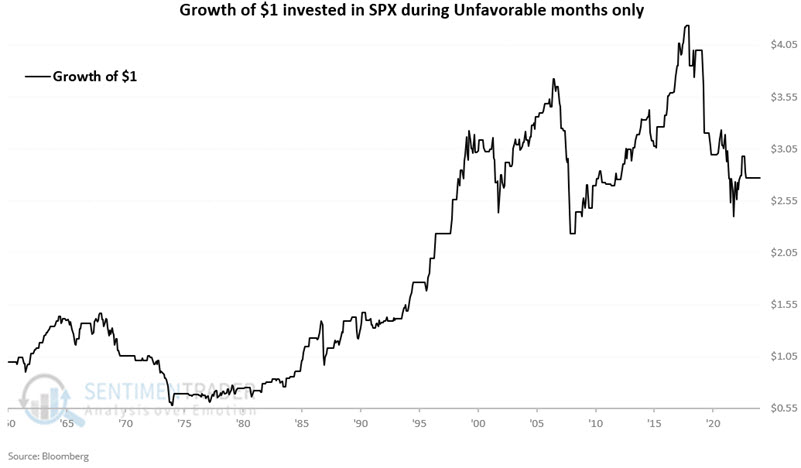
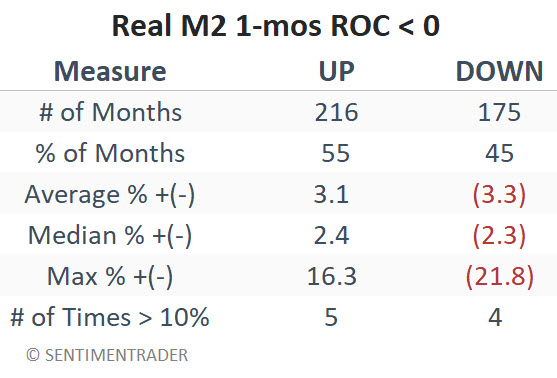
The table below summarizes results during unfavorable months.
What the research tells us…
The indicator detailed above is best used as weight of the evidence and is not recommended as a mechanical standalone strategy. The reality is that the stock market did generate a gain during what the indicator above designates as "unfavorable" months. So remember that a negative reading for Variable D does not equal a "sell everything" signal. That said, the real point is that the stock market has tended to trend higher when Variable D is positive (except for 2000-2002) and to perform vastly better when Variable D has been positive versus when it is negative. Many significant market declines occurred while Variable D was negative (the late 60s to mid-70s, 2000-2002, 2007-2009, and 2018 to the present). As of 2024-12-31, Variable D remained in positive territory, so this indicator currently falls on the favorable side of the weight of the evidence ledger.