Products
SentimenTrader Trading Tools
‍
Backtest Engine
My Trading Toolkit
Correlation Analysis
Seasonality
Market Prediction
Indicators & Data API
‍
Proprietary Indicators & Charts
Market Data API
Strategies & Scanner
‍
50+ Trading Strategies
Smart Stock Scanner
Smart Option Scanner
Research Reports
‍
Research Solutions
Reports Library
Free Resources
Simple Backtest Calculator
Simple Seasonality Calculator
The Kelly Criterion Calculator
Sentiment Geo Map
Public Research Reports
Education
Sentiment Indicators
Technical Indicators
Pricing
Company
About
In the News
Testimonials
Client Success Stories
Contact
Log inLoginSign up
< BACK TO ALL REPORTS

Low Vol (Again) As Tech Love Rises

Jason Goepfert
2017-05-23
null

Stocks are struggling to hold modest gains. Ranges are contracting and volume is sagging. Same as yesterday - historically, this has been a negative pattern for future short-term returns, but it's hard to know just how much we can rely on these given this:


Low Vol, Again

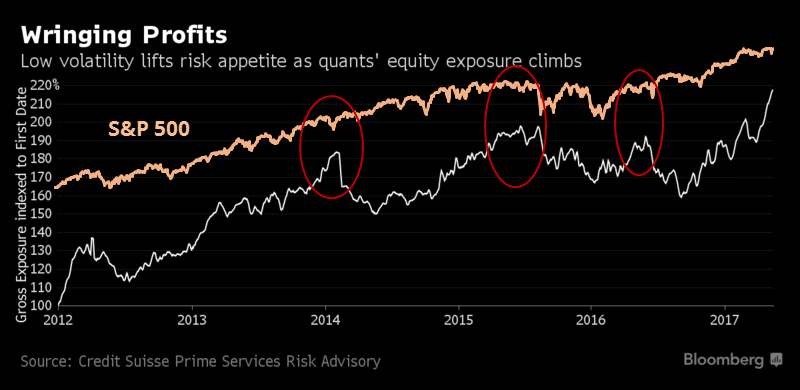
Bloomberg is out with an article similar to the one posted in the WSJ the other day about the rising equity exposure among risk parity types of funds. Among so-called low volatility funds, exposure is at an all-time high.

Like with the others, I overlaid the S&P 500 against the funds' stock exposure. Not a perfect correlation, and there were only 3 occurrences, but other than in late 2013/early 2014 when so many things failed other than blind buying, stocks got a little rocky.


Tech Love

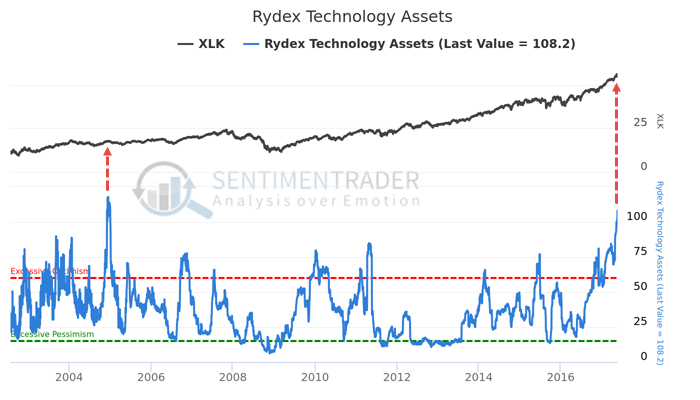
The folks who trade the Rydex family of mutual funds have rushed into the Technology fund, pushing assets above $100 million for only the 2nd time since the bubble burst.

Interestingly, assets in the main Nasdaq 100 ETF, QQQ, dropped heavily on Monday. The fund lost over $1 billion in assets, on a day the fund rallied.

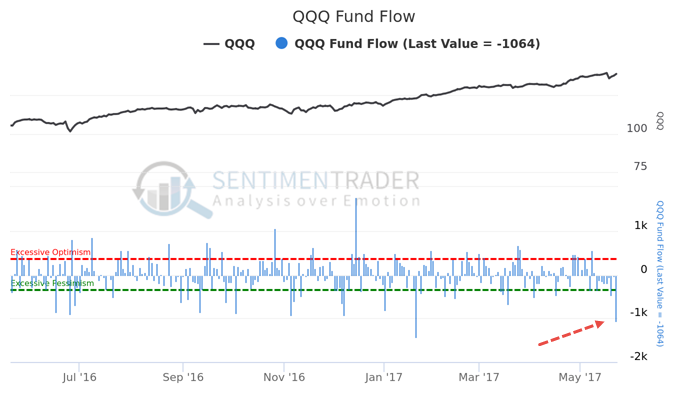
This is highly odd, especially when it's been near a high. The table below shows returns in QQQ going forward after it rallied at least 0.5% on the day but the fund leaked at least 2% in assets, and it was within 1% of a high.

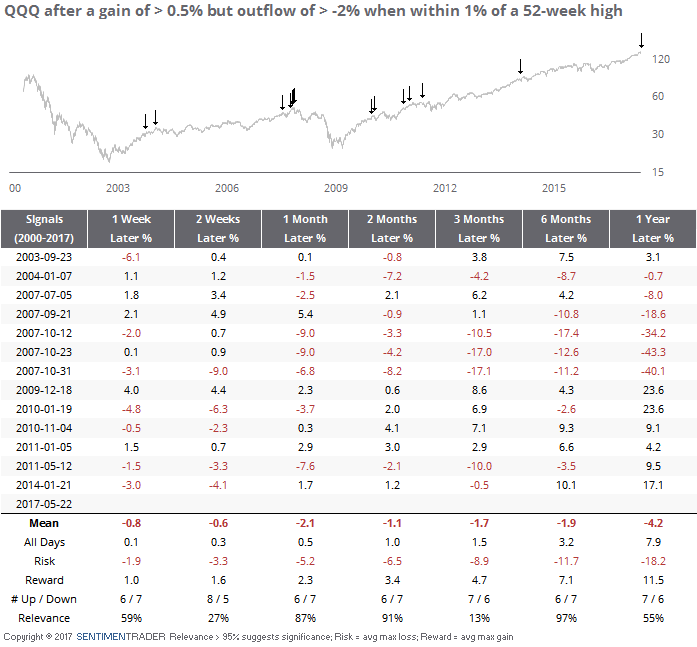
We can see that there was some struggles over the next 1-2 months. QQQ suffered a bad average return and risk/reward ratio after these signals. About the only time it managed to rally almost uninterrupted was in 2011. The others all showed losses or a tiny gain over the short- to medium-term.

PRODUCTS
SentimenTrader
Trading Tools
Indicators & Data API
‍
Strategies & Scanner
‍
Research Reports
FREE
RESOUrCES
Simple Backtest
Calculator
Simple Seasonality
Calculator
The Kelly Criterion
Calculator
Sentiment Geo Map
‍
Public Research Reports
‍
Education
Sentiment Indicators
‍
Technical Indicators
‍
Pricing
Bundle pricing
‍
FAQ
‍
Announcements
‍
COMPANY
‍
About
‍
In the News
‍
Testimonials
‍
Client Success Stories
CONTACT
‍
General Inquiries
‍
Media Inquiries
‍
Financial Professionals Inquiries
‍
© 2026 Sundial Capital Research Inc. All rights reserved.
Setsail Marketing
TermsPrivacyAffiliate Program
Risk Disclosure: The information and tools provided are for research and analytical purposes only and are not intended as investment advice. Market analysis involves uncertainty, and outcomes may differ from expectations. Users should conduct their own due diligence and consider their individual circumstances before making any financial decisions. Past performance is not necessarily indicative of future results.

Hypothetical Performance Disclosure: Hypothetical performance results have many inherent limitations, some of which are described below. No representation is being made that any account will or is likely to achieve profits or losses similar to those shown; in fact, there are frequently sharp differences between hypothetical performance results and the actual results subsequently achieved by any particular trading program. One of the limitations of hypothetical performance results is that they are generally prepared with the benefit of hindsight. In addition, hypothetical trading does not involve financial risk, and no hypothetical trading record can completely account for the impact of financial risk of actual trading. for example, the ability to withstand losses or to adhere to a particular trading program in spite of trading losses are material points which can also adversely affect actual trading results. There are numerous other factors related to the markets in general or to the implementation of any specific trading program which cannot be fully accounted for in the preparation of hypothetical performance results and all which can adversely affect trading results.

Testimonial Disclosure: Testimonials appearing on this website may not be representative of other clients or customers and is not a guarantee of future performance or success.