
Low odds, ugly tails, worse together

Key points
- The NYSE Hindenburg Omen has a 33% win rate one month later across 69 signals going back to 1965, the lowest of any version
- The NASDAQ Hindenburg Omen looks okay on average but hides a bimodal distribution, the worst one-year loss was 48%, the best gain was 46%
- When both trigger simultaneously, as they just did on May 13, the win rate drops to 39% through five months across 19 signals
- Cross-asset data after simultaneous triggers shows the dollar strengthening and every major equity index negative on average, the opposite of a capitulation pattern
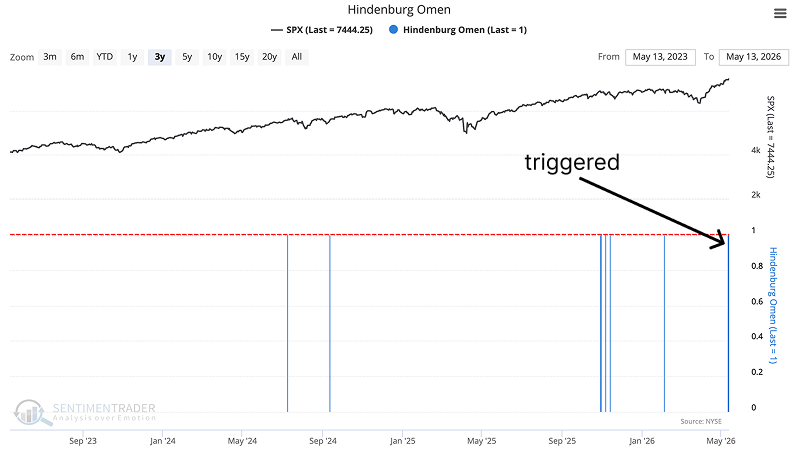
The Hindenburg Omen triggers
When a large number of stocks hit new highs and new lows at the same time, signaling fractured participation beneath the surface. On May 13, it fired on both the NYSE and the NASDAQ. But the signal is not one thing. What it means depends entirely on which version you are looking at, and each layer adds a different kind of bad news.
Low odds, then noise
The NYSE Hindenburg Omen alone has triggered 69 times since 1965. Related backtest click here.