Products
SentimenTrader Trading Tools
‍
Backtest Engine
My Trading Toolkit
Correlation Analysis
Seasonality
Market Prediction
Indicators & Data API
‍
Proprietary Indicators & Charts
Market Data API
Strategies & Scanner
‍
50+ Trading Strategies
Smart Stock Scanner
Smart Option Scanner
Research Reports
‍
Research Solutions
Reports Library
Free Resources
Simple Backtest Calculator
Simple Seasonality Calculator
The Kelly Criterion Calculator
Sentiment Geo Map
Public Research Reports
Education
Sentiment Indicators
Technical Indicators
Pricing
Company
About
In the News
Testimonials
Client Success Stories
Contact
Log inLoginSign up
< BACK TO ALL REPORTS

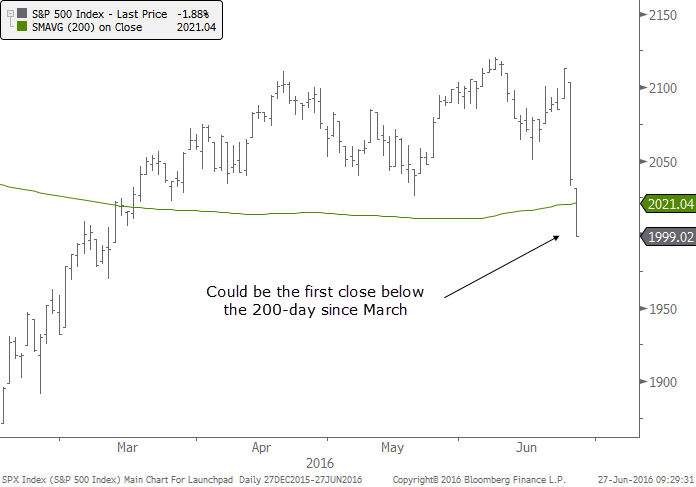
Losing The 200-Day Average

Jason Goepfert
2016-06-27
null

The S&P 500 is in the process of closing below its 200-day average today, which would be the first time in more than three months. Many investors use the average as a clue as to whether stocks are in a long-term bull or bear market environment.

201606127_cross200_chart

The table below shows how the S&P performed going forward when it closed below its long-term average for the first time in at least 30 days but not more than 100 days. That gives us a selection of comparable dates (it's not really comparable if the S&P had been above its average for only a week, or longer than a year, for example).

201606127_cross200

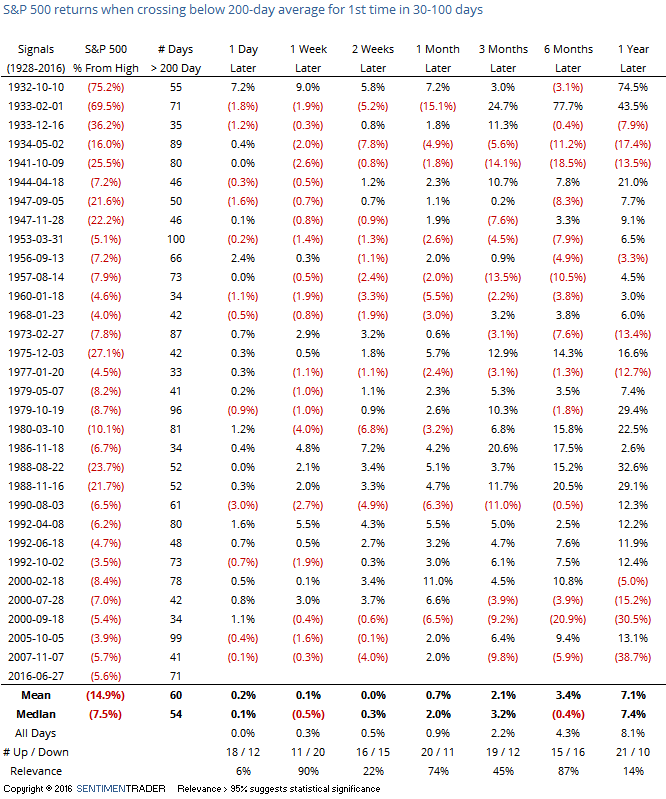
As we've seen in the past with similar studies, losing the average tended to lead to some short-term mean reversion (rally) then another bout of selling pressure. A week later, the S&P was higher only 11 out of 31 times.

Here is the same study, but only using instances since the S&P became a 500-member index in 1957.

201606127_cross200_1957

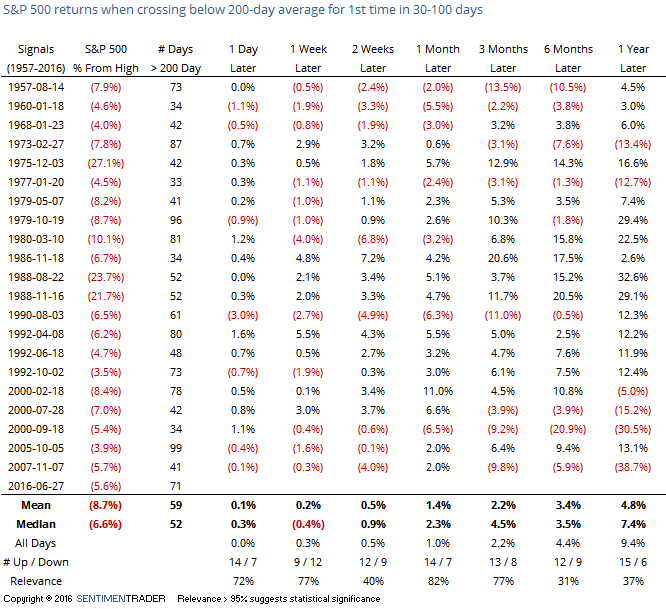
Mostly the same conclusion - strength in the very short-term, some selling pressure over the next week or so, then mostly higher.

Our current situation is unusual in that the S&P is still fairly close to a multi-year high. So let's filter the table to only includes instances that occurred within 10% of a 3-year high.

201606127_cross200_high

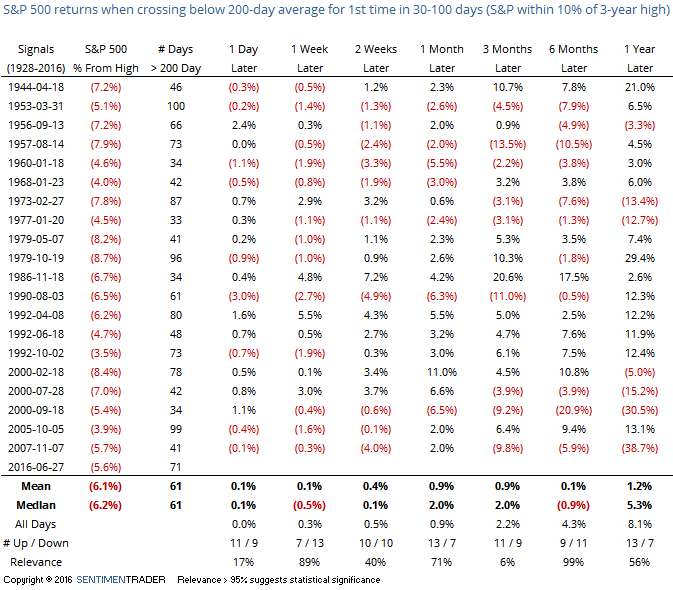
There was no real change in the results, as the same basic pattern held up. Six-month returns were troubling, however, with only 9 rallies out of 20 occurrences and a significantly negative average return.

With further selling pressure from the gap down open, the S&P is at risk of losing at least 1% today. When it lost 1% on Friday and again on Monday, the S&P closed higher at some point in the next three days 103 out of 117 times. When Friday's loss was 2% or more, then it rallied 33 out of 35 times.

This mostly confirms what we showed earlier with regard to the gaps down in recent days. A down day today should lead to a bounce into Tuesday/Wednesday but it would be rare if that was "it" for the selling pressure looking out over the next couple of weeks.

PRODUCTS
SentimenTrader
Trading Tools
Indicators & Data API
‍
Strategies & Scanner
‍
Research Reports
FREE
RESOUrCES
Simple Backtest
Calculator
Simple Seasonality
Calculator
The Kelly Criterion
Calculator
Sentiment Geo Map
‍
Public Research Reports
‍
Education
Sentiment Indicators
‍
Technical Indicators
‍
Pricing
Bundle pricing
‍
FAQ
‍
Announcements
‍
COMPANY
‍
About
‍
In the News
‍
Testimonials
‍
Client Success Stories
CONTACT
‍
General Inquiries
‍
Media Inquiries
‍
Financial Professionals Inquiries
‍
© 2026 Sundial Capital Research Inc. All rights reserved.
Setsail Marketing
TermsPrivacyAffiliate Program
Risk Disclosure: The information and tools provided are for research and analytical purposes only and are not intended as investment advice. Market analysis involves uncertainty, and outcomes may differ from expectations. Users should conduct their own due diligence and consider their individual circumstances before making any financial decisions. Past performance is not necessarily indicative of future results.

Hypothetical Performance Disclosure: Hypothetical performance results have many inherent limitations, some of which are described below. No representation is being made that any account will or is likely to achieve profits or losses similar to those shown; in fact, there are frequently sharp differences between hypothetical performance results and the actual results subsequently achieved by any particular trading program. One of the limitations of hypothetical performance results is that they are generally prepared with the benefit of hindsight. In addition, hypothetical trading does not involve financial risk, and no hypothetical trading record can completely account for the impact of financial risk of actual trading. for example, the ability to withstand losses or to adhere to a particular trading program in spite of trading losses are material points which can also adversely affect actual trading results. There are numerous other factors related to the markets in general or to the implementation of any specific trading program which cannot be fully accounted for in the preparation of hypothetical performance results and all which can adversely affect trading results.

Testimonial Disclosure: Testimonials appearing on this website may not be representative of other clients or customers and is not a guarantee of future performance or success.