
Looking past major assets' knee-jerk election reactions

Key points:
- Stocks have soared in the three sessions after the election, while the dollar gained and gold dumped
- Similar asset reactions after elections have preceded further rallies in stocks and the dollar
- The least similar reactions often led to lower stock prices, furthering the idea that the current reaction is a positive
A post-election reaction
We try to avoid knee-jerk reactions. Over the years, it has become apparent time and time and time again that in auction markets, the first reaction is most often a false one.
So, it's usually a mistake to read much of anything into the immediate market reaction to an important news event like the presidential election. The knee-jerk is typically limited to just a single day, maybe two or three, but it's more of a trend after that. Now that participants have had a few sessions to evaluate the implications of a return of President Trump, we can perhaps get a bit more of a read on what it may mean.
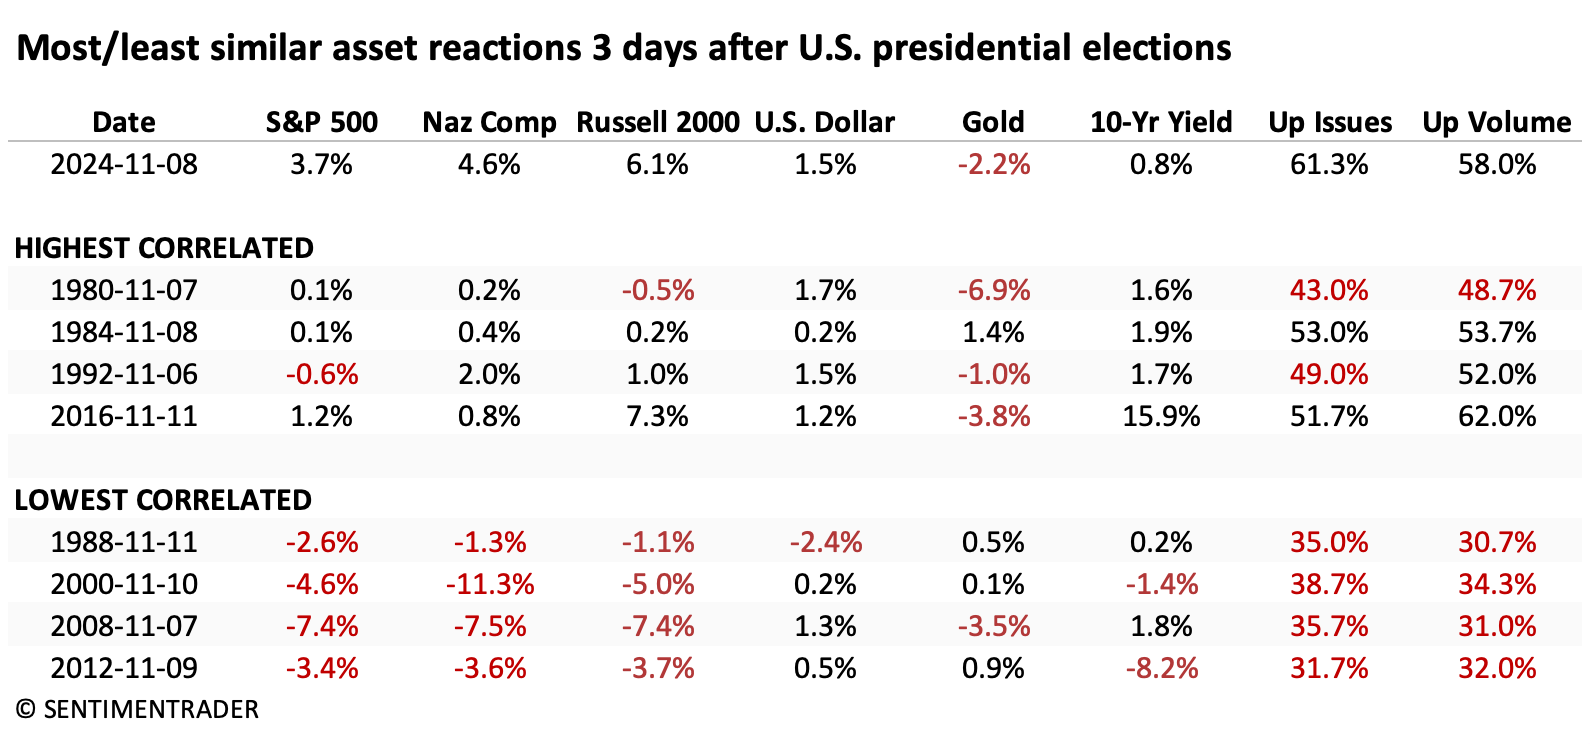
The table below shows the 3-day asset class reactions after elections that are the most and least similar to the past few days. The sample size is necessarily limited to the fact that the elections are only every four years, and most indices haven't been around for more than about a dozen elections.
Generally, the highest-correlated reactions saw stocks jump, the dollar rise, gold decline, and yields rise, with decent breadth on the NYSE. The "Up Issues" and "Up Volume" columns in the table represent the average percentage of NYSE issues that rose and the volume that flowed into those issues in the three sessions following an election.
The lowest correlated reactions tended to see feeble reactions across stock indexes, while gold rose. The dollar and yields were mixed.
A promising sign for stocks
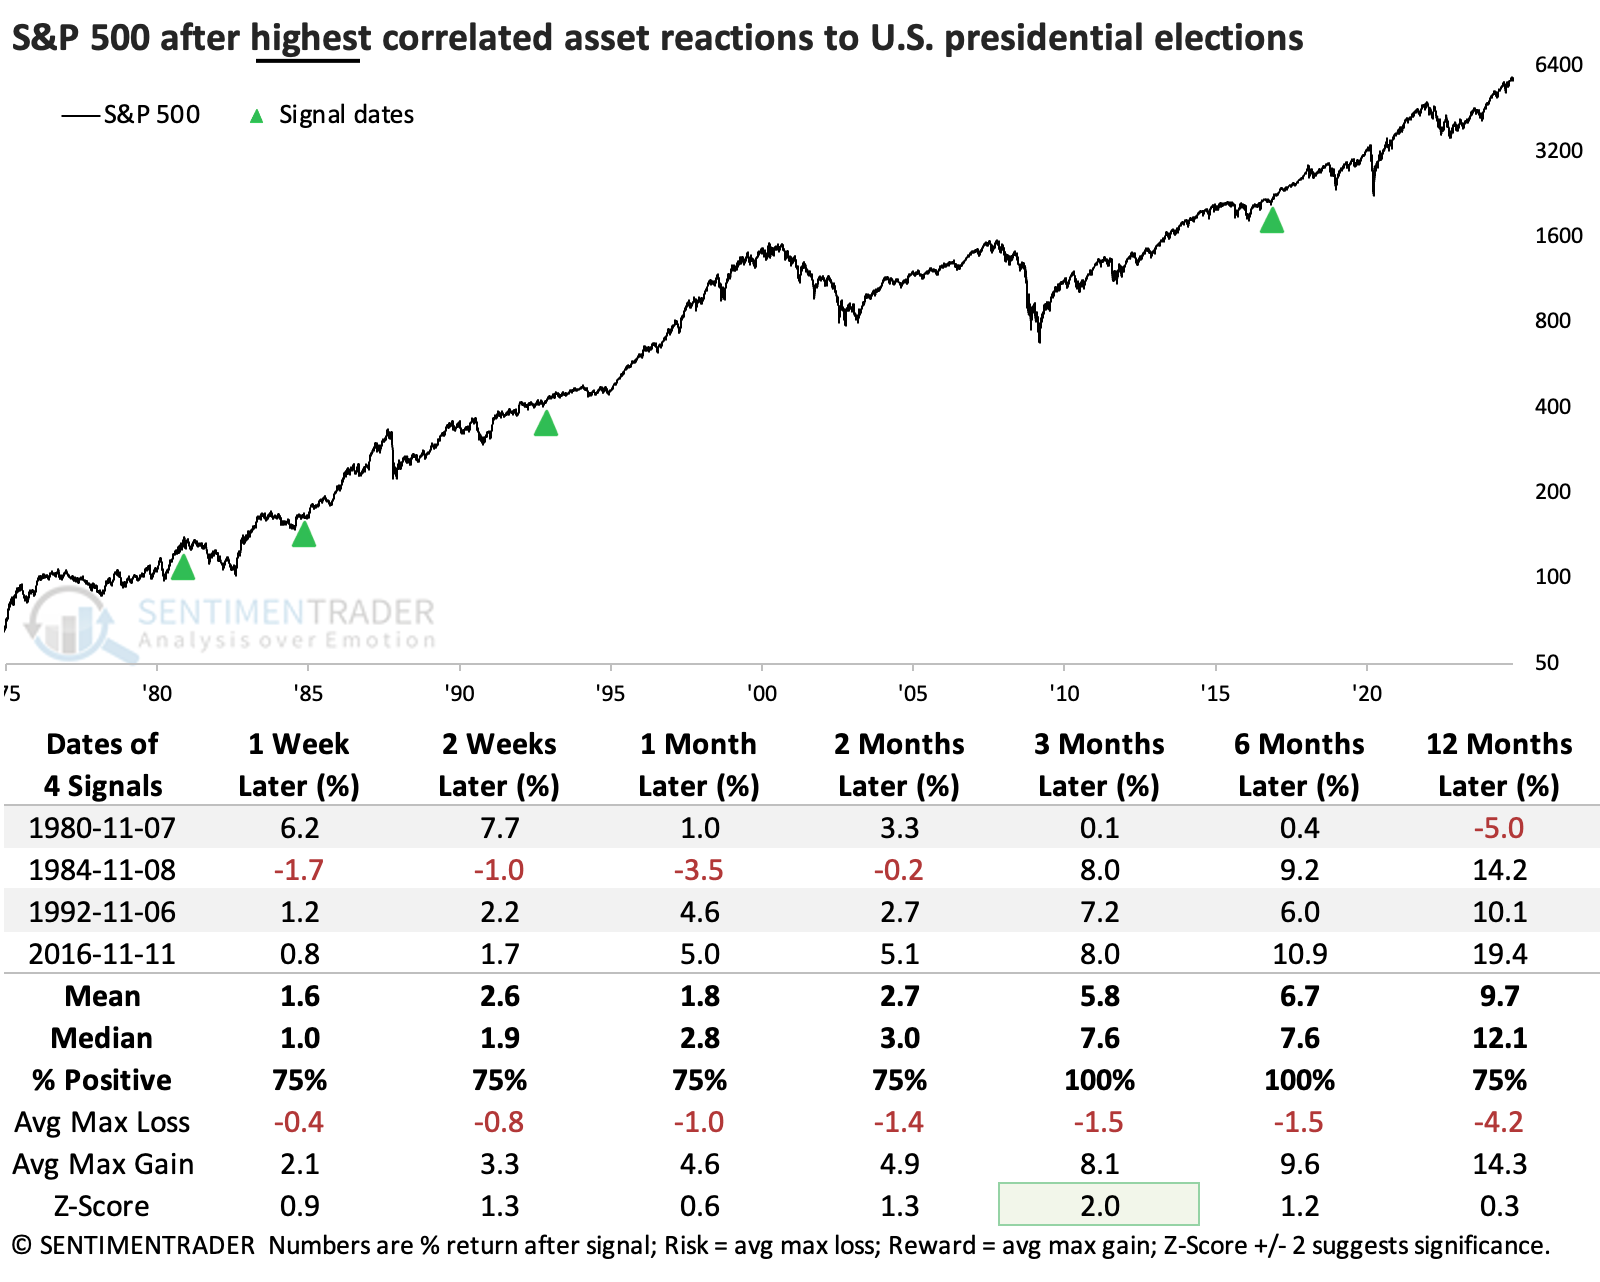
After the highest correlated asset reactions (again, the three-day moves that were most similar to the current election), the S&P 500 did very well. There were no significant declines over the next few months, though a couple eventually morphed into recessions. After three of them, the S&P rose more than +7% in the following three months.
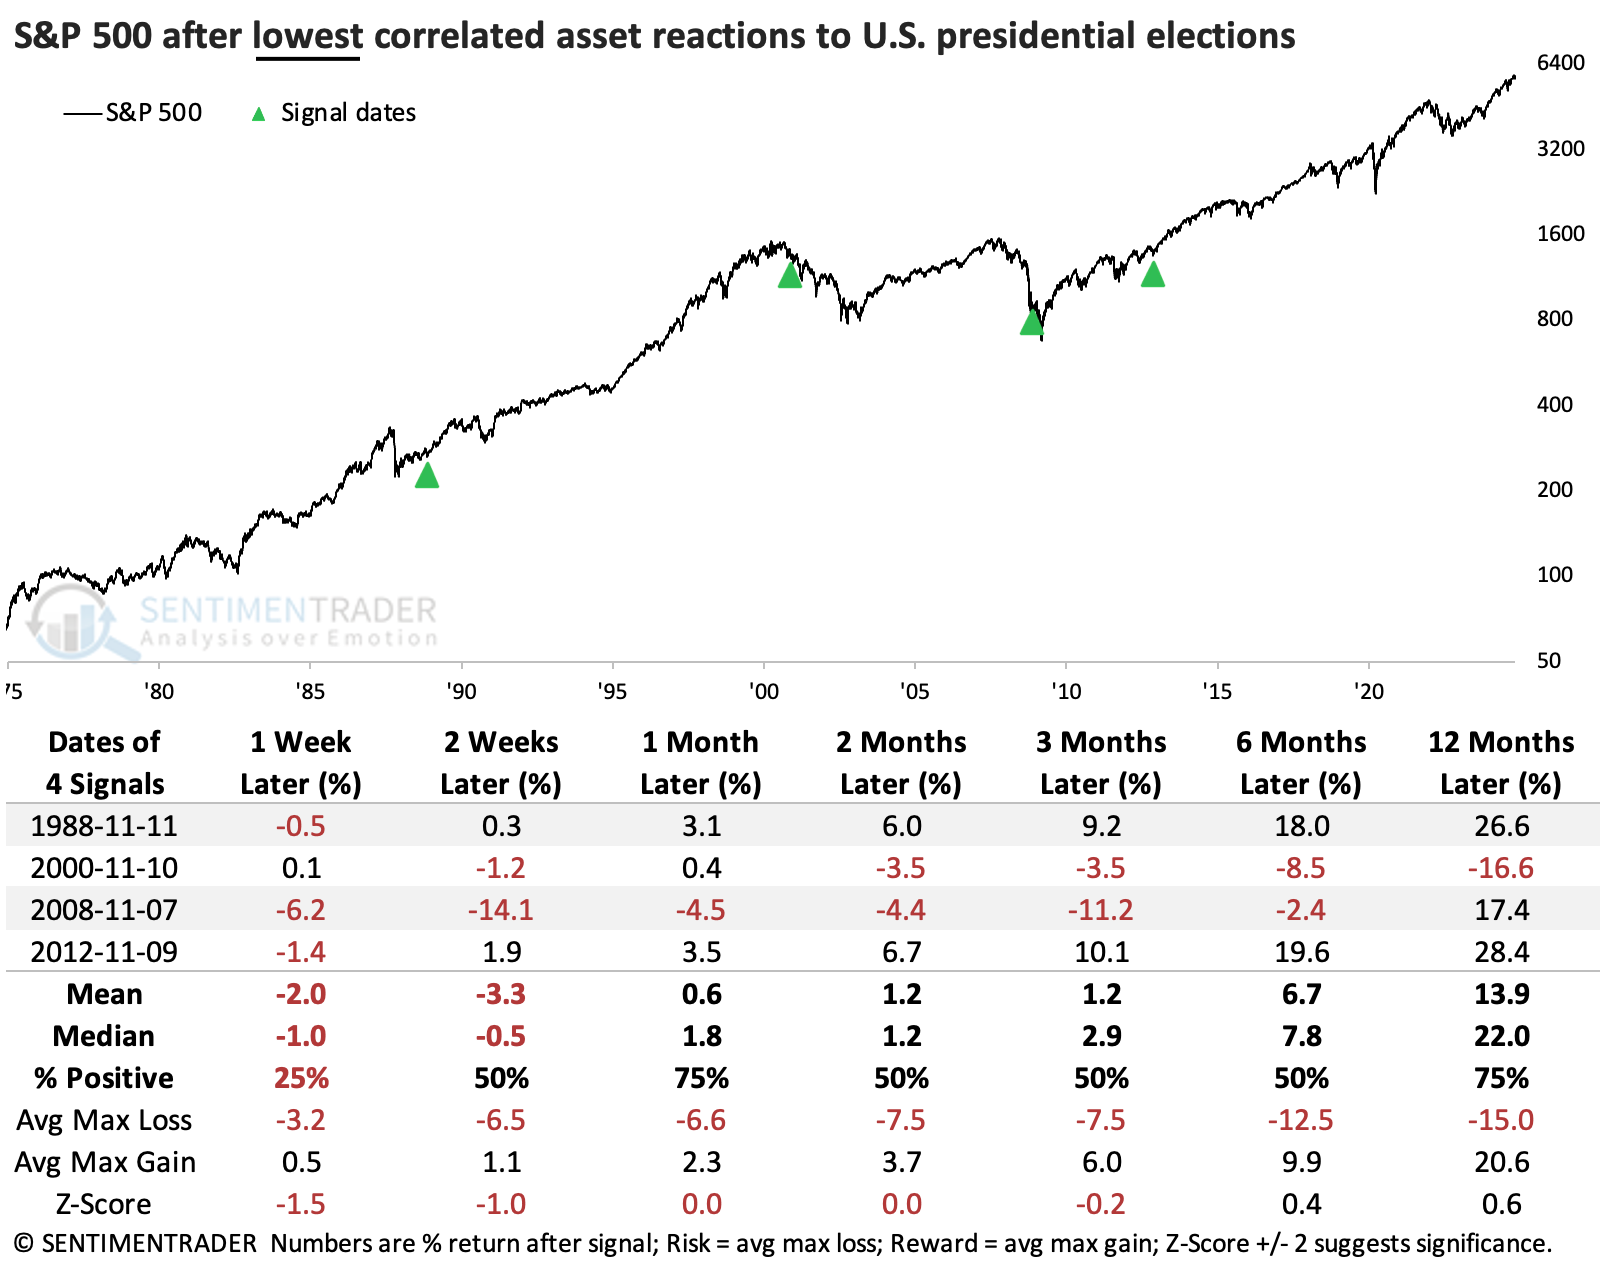
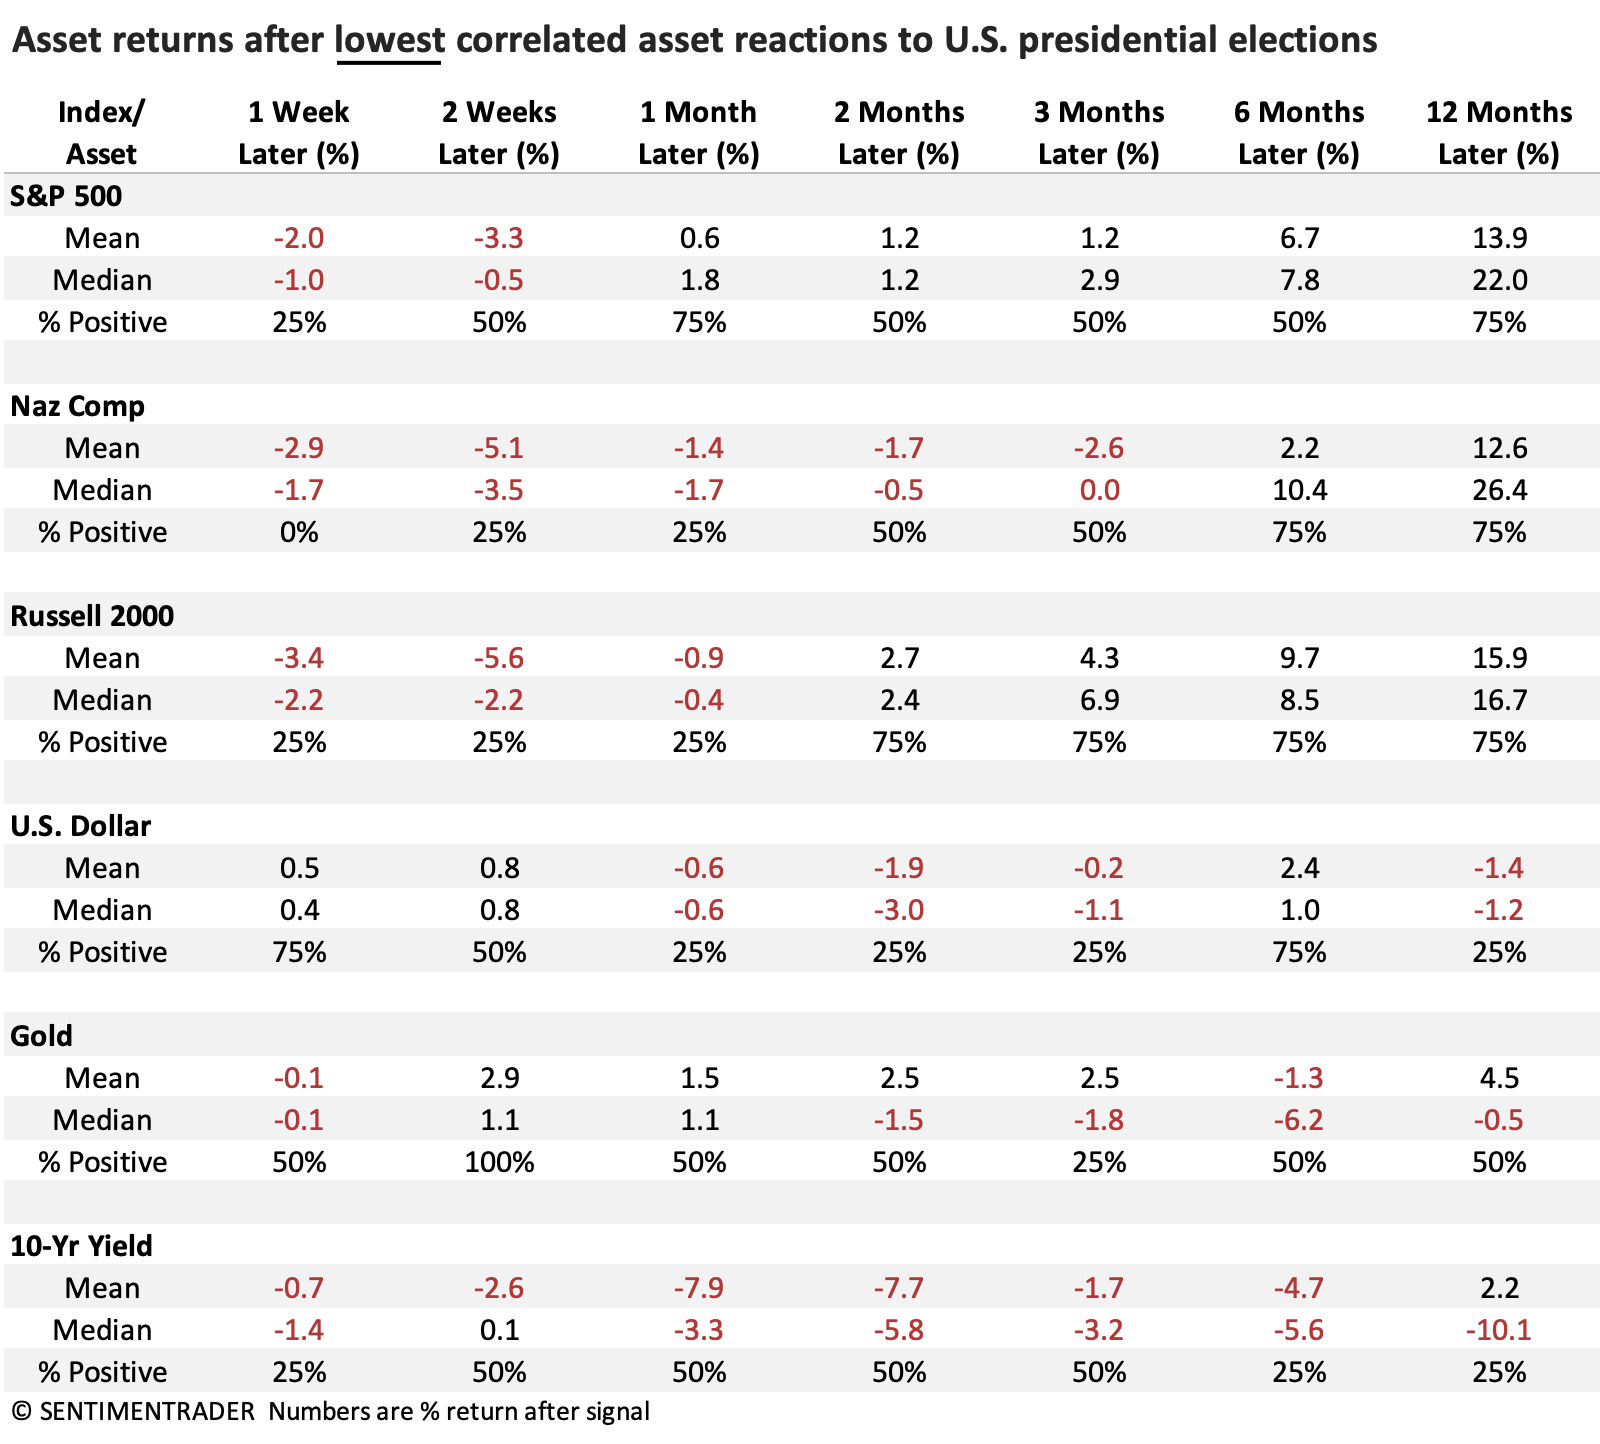
When sample sizes are tiny, we like to look at counter-examples. If they give us the opposite impression, we can have a little more confidence in any possible conclusion. So, the table below shows S&P returns after the lowest correlated reactions to elections.
It wasn't clear-cut, but stocks did perform worse than after the highest correlated reactions. The S&P suffered relatively large losses twice in the months ahead, though it also enjoyed large gains twice. There's not much to conclude there.
Below, we expand the returns to look at all the asset classes we monitored in the first table. Those returns were good across the equity indices, especially the Nasdaq and Russell. The dollar also rose all four times over the next 2-3 months, which made it a challenging environment for gold. Yields were mixed.
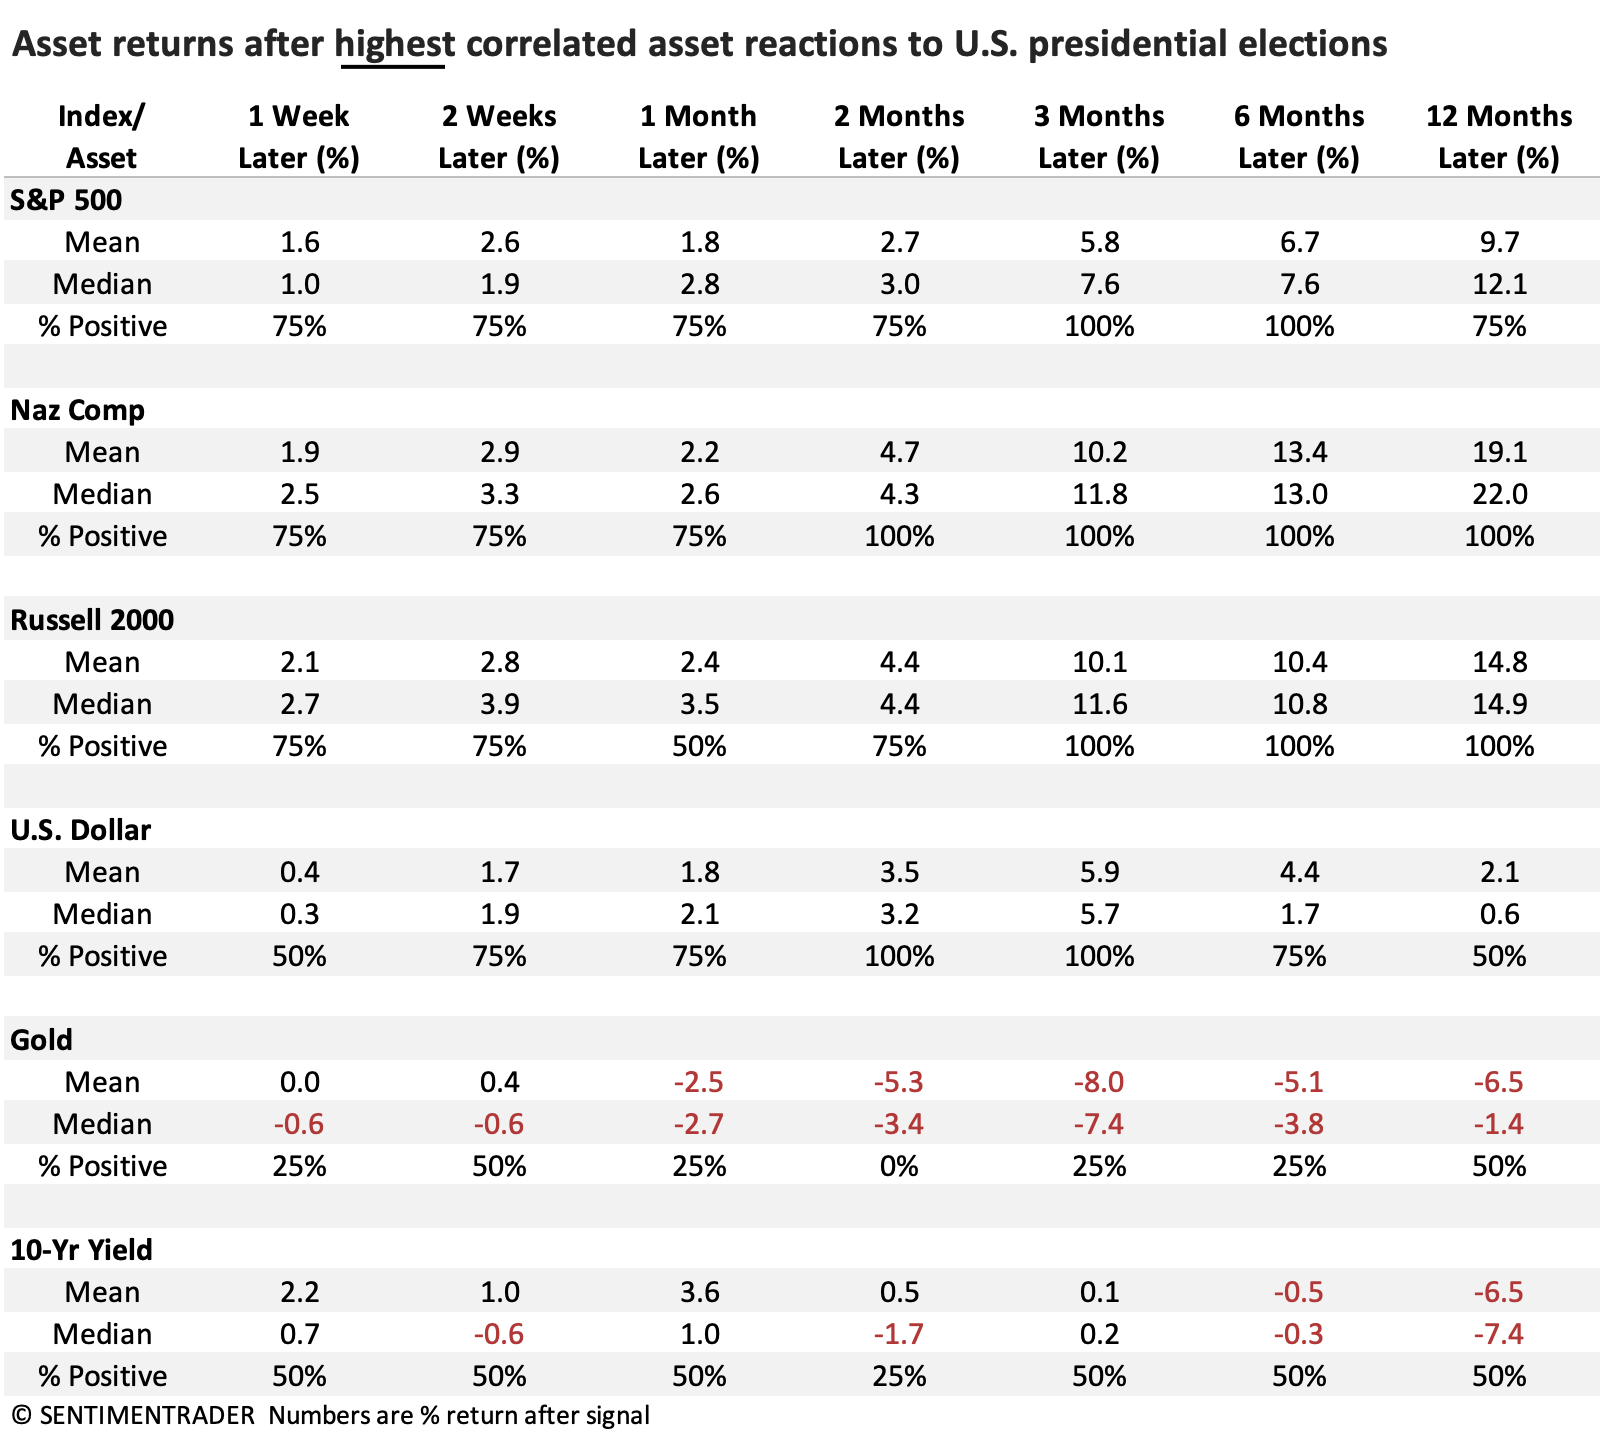
After the lowest correlated asset class reactions, stocks and the dollar behaved much less favorably over the next few months.
What the research tells us...
Dealing with tiny sample sizes can be challenging, but that doesn't mean they should always be ignored. Sometimes, there can be value in considering them if their outcomes are relatively consistent, and confidence can increase if opposing signals give opposite conclusions. We can see that above, with stocks doing quite well after the highest correlated asset class reactions and poorly after the lowest correlated ones.
This bodes well for stocks, especially higher-beta indexes like the Nasdaq Composite and Russell 2000, at least over the next two to six months. The same goes for the dollar, which would be a drag on gold's potential. Again, we're dealing with tiny sample sizes and only a few days' reaction to a major event, so some reservation is required.