
Looking for Opportunity in Natural Gas futures and ETF

Key points:
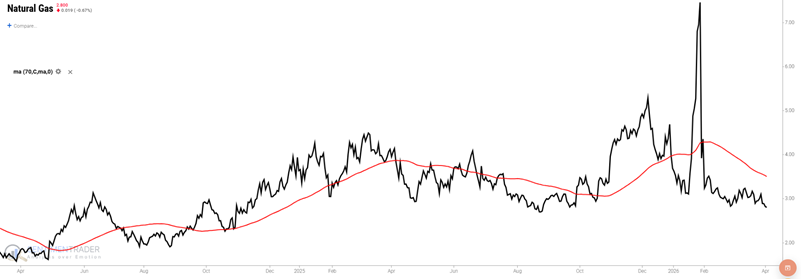
- Natural gas soared briefly during January 2026; since then, it has been declining steadily
- This volatile - but highly cyclical - market is presently within a favorable seasonal window; however, waiting for price confirmation might improve the odds of success
- ETF ticker UNG may offer an alternative to trading riskier Natural Gas futures
Natural Gas is a very volatile market
The daily chart below shows the price action of Natural Gas futures over the past few years. Note that this market rallied sharply in January 2026, but then the rally failed, and the price has been trending sharply lower ever since. Please note that the price is presently holding below the 70-day exponential moving average (the red line in the chart below).
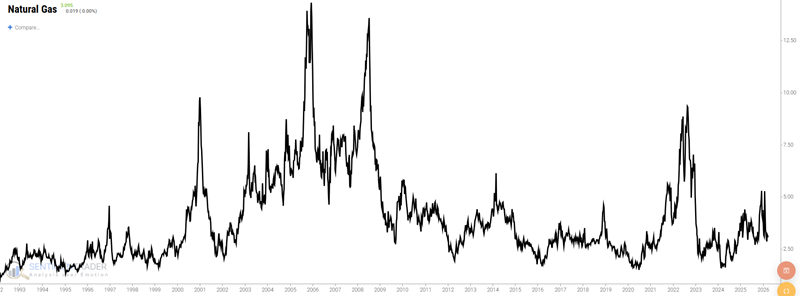
The following weekly chart, stretching back to the early 1990s, reminds us that what's happened in recent months is not at all uncommon in this highly volatile market. In fact, in this chart, the January 2026 spike doesn't even seem all that remarkable.
Despite the recent price decline, there is reason to believe a reversal of fortunes is possible in the months ahead, and that now is the time for traders to start looking for an opportunity to play the long side.
Natural Gas is a highly seasonal market
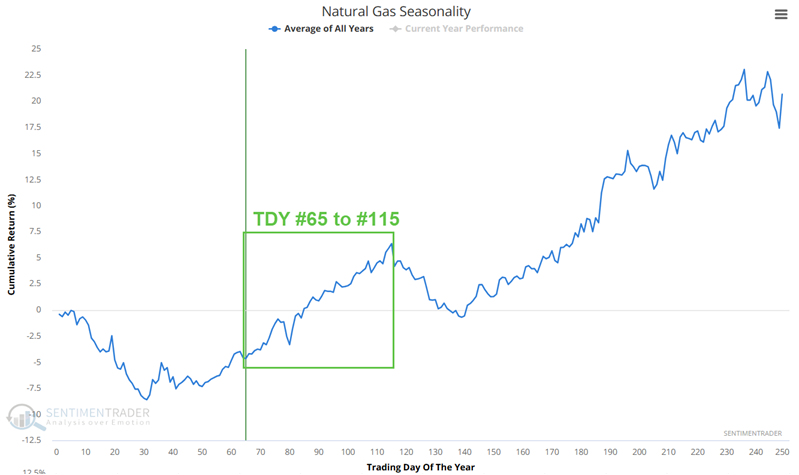
The chart below displays the annual seasonal trend for natural gas futures (ticker NG). Note the highlighted period from Trading Day of the Year #65 through TDY #115. For 2026, this period extends from April 2nd through June 15th.
We will take a closer look at historical performance during this timeframe in a moment, but first, a few thoughts on making the most of using seasonality as a trading filter.
An overview of trading seasonality
The most important thing to remember about seasonality is that it is simply an average of what has happened in the past - it is NOT a roadmap for what will happen this year. My favorite way to explain it is that it "tells you when to look in which direction." But using seasonality as an "automated" buy or sell signal generator is perilous - particularly when it runs counter to a market trending sharply in the other direction. In simplest terms:
"If seasonality and price trend (however a given trader defines "trend") align, there is potential opportunity."
When a historically favorable (or unfavorable) seasonal period begins, a trader who wants to play this potentially advantageous period is typically best advised to either:
- Look for price action to be trending in the expected direction (price in an uptrend if entering a favorable seasonal period or price in a downtrend if entering an unfavorable seasonal period)
- Look for an upside reversal from a deeply oversold market (which is theoretically "due for a bounce") in the case of a new favorable seasonal trend or for a downside reversal from a sharply overbought market in the case of a new unfavorable seasonal trend
But what if neither of the above exists at the start of a new seasonal period? In that case, a trader may be wise to hold off on taking a position and wait for some sign of price confirmation to develop (using their preferred trend confirmation method). Again, seasonality is not a magic trick, nor is it anywhere near a "sure thing." It is merely an indicator; like all indicators, it will experience good and bad signals.
The danger in waiting for confirmation is that a significant portion of the seasonal price move might be missed. Conversely, the risk of buying into an oversold market at the outset of a favorable seasonal period is that the market could continue to trade sharply lower. A solid, objective risk management plan is essential to avoid a significant loss in such a scenario.
Natural Gas tends to perform well during the spring months
The seasonally favorable period extends from the close of TDY #65 through the closing of TDY #115. For 2026, this period extends from the close on April 2nd through the close on June 15th.
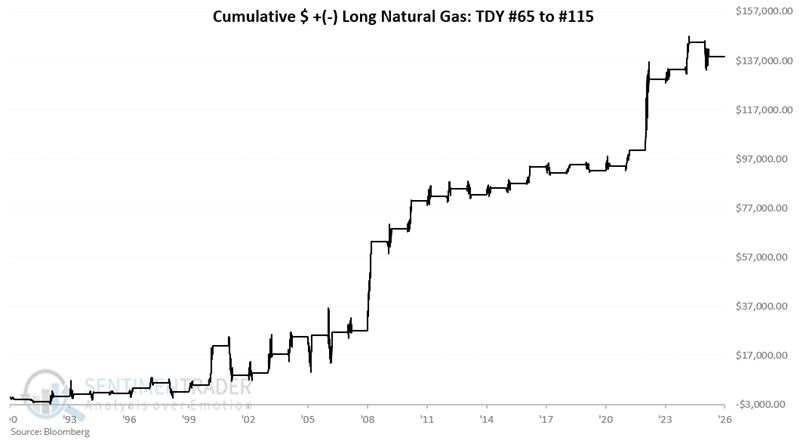
The chart below displays the cumulative hypothetical performance of holding a single Natural Gas futures contract from the close on TDY #65 through TDY #115 each year since 1990, when NG futures started trading.
The table below summarizes performance results during this favorable seasonal period.
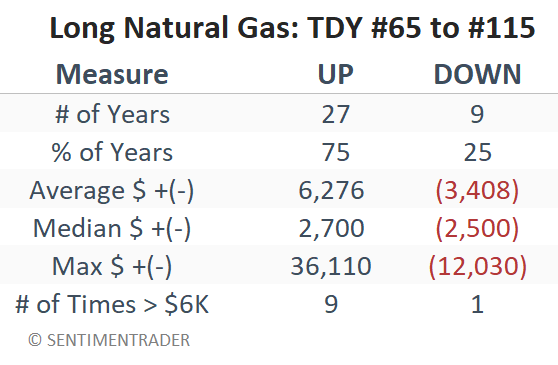
The good news is that historical results have been quite favorable overall. The bad news is that there is no guarantee that future results will be similar. Likewise, a 75% win rate means it has lost once every 4 years; the median loss was -$2,500, and the maximum loss for natural gas futures during this period was -$12,303. These facts remind us that Natural Gas futures are inherently very volatile, require very deep pockets to trade, and that a solid understanding of the unlimited risk inherent in futures trading is essential.
Using an ETF as an alternative
The United States Natural Gas Fund ETF (UNG) is an exchange-traded security designed to track in percentage terms the movements of Natural Gas futures prices. UNG shares can be bought and sold like shares of stock and can offer non-futures traders exposure to the natural gas market without the unlimited risk associated with futures trading.
The futures contracts held by ticker UNG are based on its own prescribed roll schedule. This means that the daily percentage fluctuation in UNG may differ from that of the spot contract we used above to track NG futures directly.
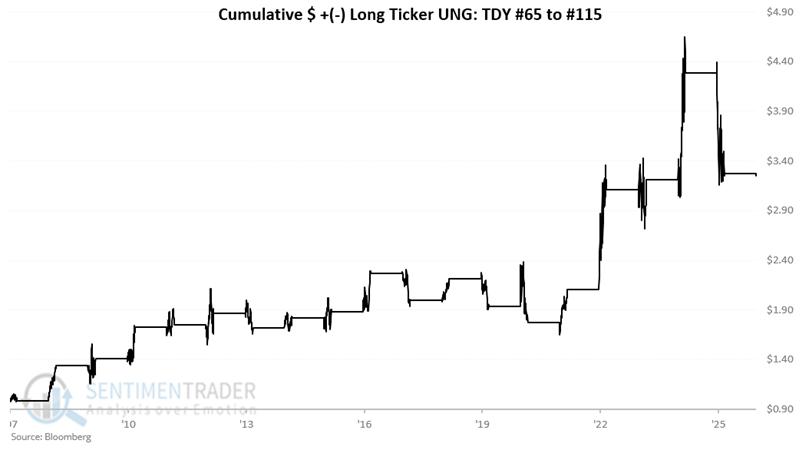
The chart below shows the growth of $1 invested in UNG for Natural Gas futures from the close of TDY #65 through TDY #115.
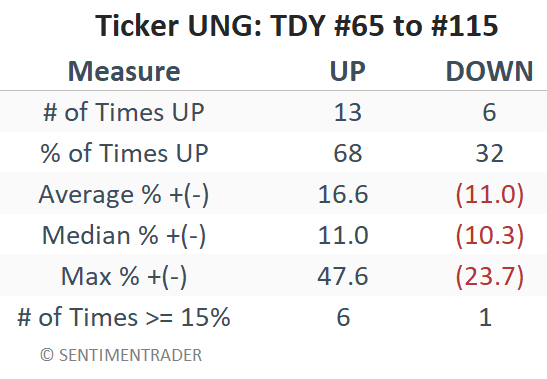
The table below summarizes performance results during this favorable seasonal period.
What the research tells us…
Natural Gas is a highly cyclical market. It tends to show weakness during the winter months of December through February and strength from late winter into spring. That said, traders must recognize the exceptionally volatile nature of Natural Gas futures. Traders must also decide whether to jump in on the long side now, even while the price trend is not confirming the favorable seasonal trend, or to wait for price confirmation. Non-futures traders who wish to play the long side of Natural Gas can look to ticker UNG, with the caveat that the ETF's returns have not been as robust as those of the futures themselves.