
Looking for Opportunities in Soybeans

Key Points:
- Due primarily to the U.S. planting cycle, soybean prices have tended to move in a fairly consistent cyclical pattern for almost 90 years
- Beans have just entered the beginning of the favorable part of the trading year
- Via either futures contracts or a specific ETF, traders should now be looking for opportunities to play the long side of the soybean market
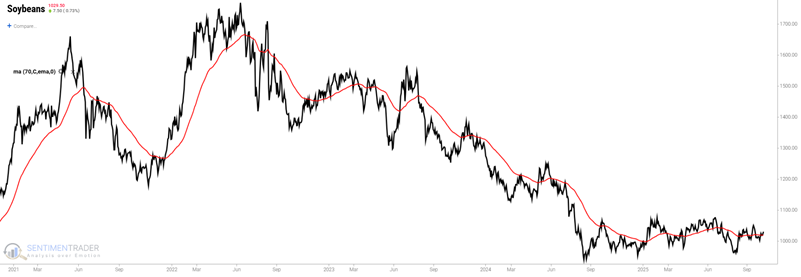
Soybeans have struggled overall in recent years
Soybeans trended lower between 2022 and 2024 for more than two years. Since bottoming in August 2024, they have been trending sideways in a relatively narrow range.
So, which way from here for soybeans? History suggests traders should look for opportunities to trade the long side between now and July 2026.
The chart below shows the annual seasonal trend for soybean futures. We can see that, in general, there is a bullish period and a bearish period. The bullish period starts at the close on Trading Day of the Year (TDY) #191 and extends through Trading Day #131 of the following year. The bearish period runs from TDY #131 through TDY #191.
For 2025-26, the TDY #191 to #131 period began at the close on October 6th and will extend into July 2026.
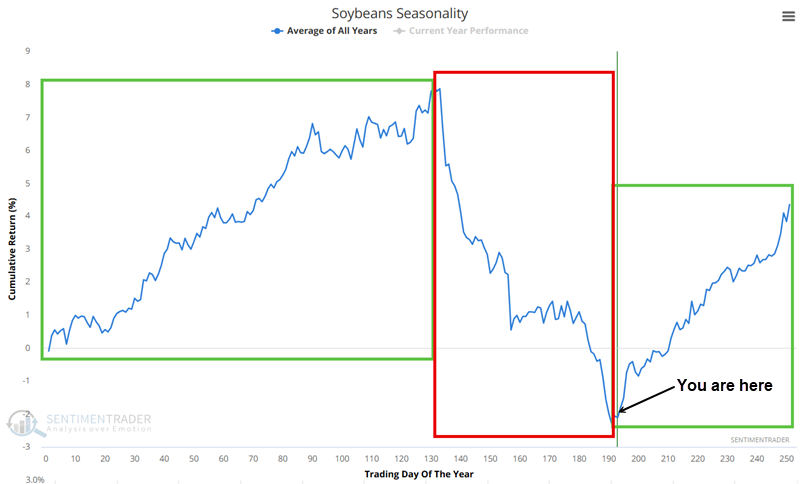
It is important to point out that soybean prices do not simply mechanically follow this script year in and year out. There is no implication being made that beans will immediately embark on a long, steady climb that will continue unabated between now and next July. Still, over time, the seasonal trend has proven useful. The message here is simply that the odds favor looking for opportunities to play the long side over the short side.
Before looking at results, let's briefly explain why it tends to work.
Why seasonality tends to persist in soybeans
The bulk of soybeans grown in the U.S. is planted in Midwestern states in the early spring. Beans grow through the summer and are harvested in early fall. Each year, as soybean harvesting season begins in the U.S. Midwest, little doubt remains about the state of the crop harvest. It is either good, bad, or somewhere in between, but the critical point is that the state of the crop harvest is typically a known quantity.
Once the harvesting is done, all eyes turn to next year's crop. At that point, there is no way to know what next year's harvest will bring. As a result, a certain amount of risk premium eventually gets built into the price of futures contracts. The premium can rise substantially depending on how well the planting season goes the following spring.
Finally, once the seeds are in the ground and the growing season begins, analysts can assess the state of the current year's crop (typically in late spring or early summer). The premium that was built into soybean prices during the winter and spring months begins to dissipate, pressuring prices and generally resulting in lower bean prices overall.
A closer look at annual seasonal results
The chart below displays the hypothetical equity curve achieved by holding a long position in soybean futures from TDY #191 through #131 each year since 1937. We see plenty of choppy action along the way, and weakness in recent years. Nevertheless, the long-term upward trend is apparent.
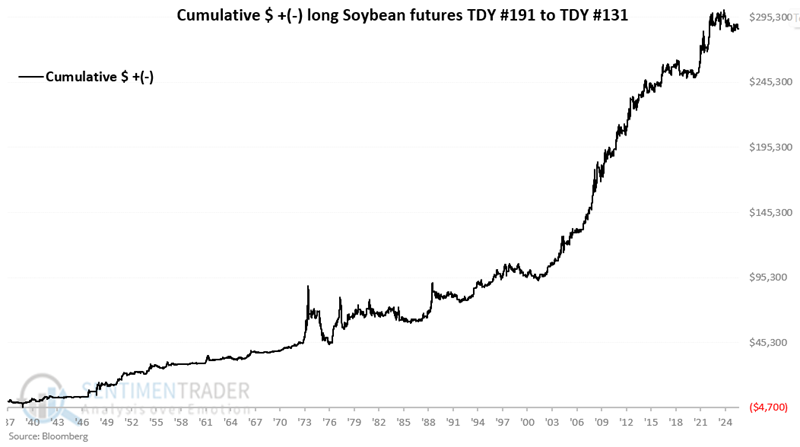
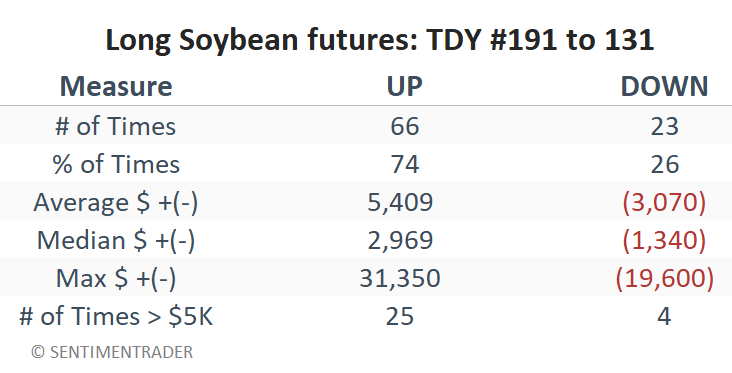
The table below summarizes the results.
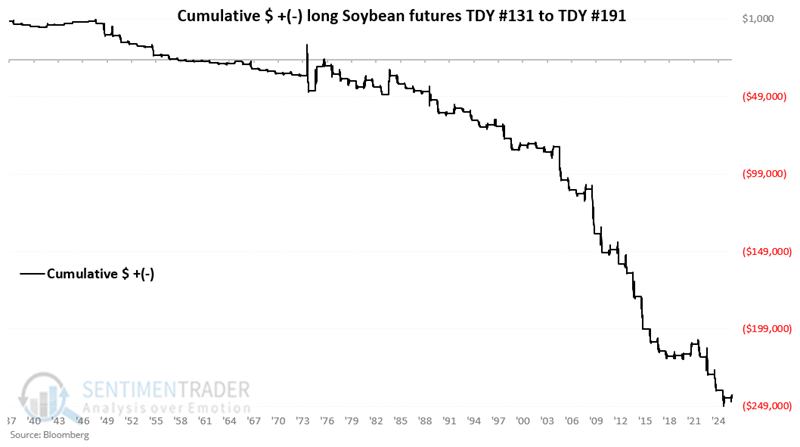
Now, let's compare this to soybean performance from TDY #131 through #191. The chart below displays the hypothetical equity curve achieved by holding a long position in soybean futures from TDY #131 through #191 yearly since 1937. The tendency for weakness and the stark contrast to the results for the rest of the year shown above are obvious.
The table below summarizes the results.
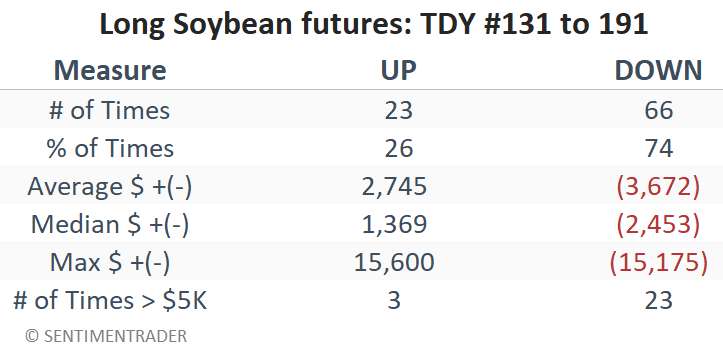
A key fact to note is that soybean prices rose 74% of the time during the TDY #191 to #131 period, while they fell 74% of the time during the TDY #131 through #191 period. This type of long-term consistency offers traders an opportunity- but it is never a "sure thing."
An alternative for non-futures traders
Futures trading can involve much leverage and the potential for limited risk, so it is not for everyone. Non-futures traders who wish to participate in soybean price movements (particularly during the favorable TDY #191 to #131 period) might consider trading shares of the Teucrium Soybeans Fund ETF (SOYB), which trade like stock shares.
What the research tells us…
The standard seasonality caveat applies: In any given year, anything can happen. Still, over the past eighty-nine years, roughly three out of every four years have seen soybean prices advance from Fall into the following summer, and decline from mid-summer into early Fall. Should traders buy soybean futures or ETFs and hold for the next nine months? That's not what is being suggested. The historical data imply that the seasonal odds favor the bullish side of the bean market starting now, and that traders should review their favorite trend measures and entry techniques, and look for opportunities to play the long side.