
Long-term trends weaken as the S&P 500 hovers near highs

Key points
- Market breadth is deteriorating significantly, with fewer than 55% of S&P 500 stocks trading above their 200-day moving average despite the index hovering within 3% of a record high.
- Historically, this specific divergence has preceded negative returns and elevated risk, particularly over the subsequent 2 to 16 weeks.
- Broader composite models, including the Market Environment and Risk On/Off Indicator, are signaling "unhealthy" or "risk-off" conditions, corroborating the breadth warning.
"Markets are strongest when they are broad and weakest when they narrow to a handful of blue-chip names" - Bob Farrell
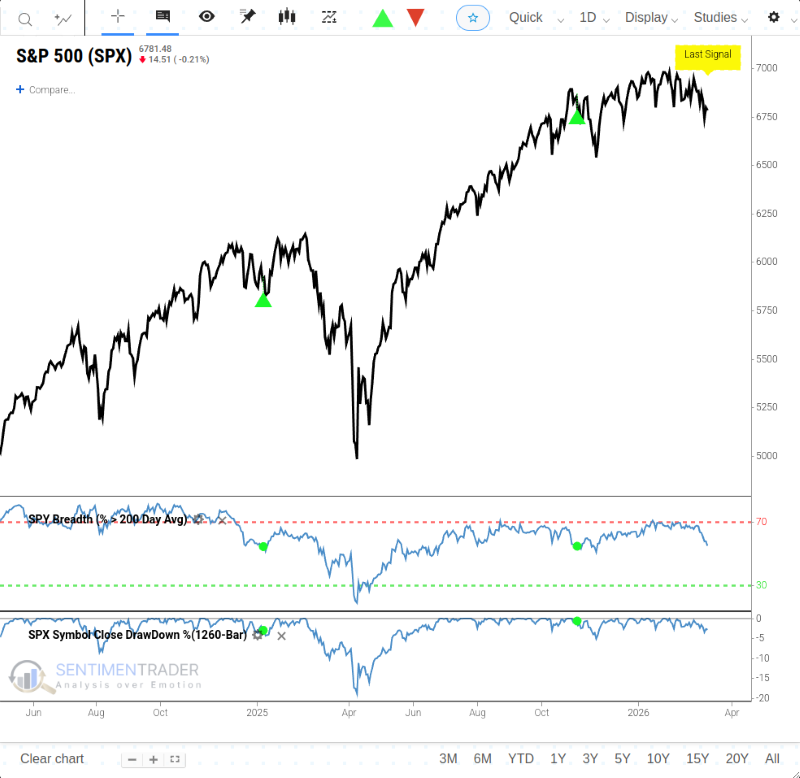
Bob Farrell's 7th rule in his 10 rules for investing is undoubtedly being tested as market breadth deteriorates. Yet, the S&P 500 remains resilient, hovering just under its record high. Said another way, the generals are holding steady while the soldiers falter.
The latest indicator highlighting the dwindling participation comes from the percentage of stocks in the S&P 500 trading above their 200-day average. For only the 9th time since 1998, fewer than 55% of the members held above their long-term averages as the S&P 500 resided within 3% of a high.
Similar breadth conditions have preceded negative returns
When fewer than 55% of S&P 500 component stocks are priced above their 200-day moving averages while the index itself remains within 3% of a five-year high, the world's most benchmarked index typically exhibits sluggish short-term performance. Furthermore, the risk is particularly acute at the two-week mark, where the probability of the index declining is as high as 67%. For related backtest, click here.
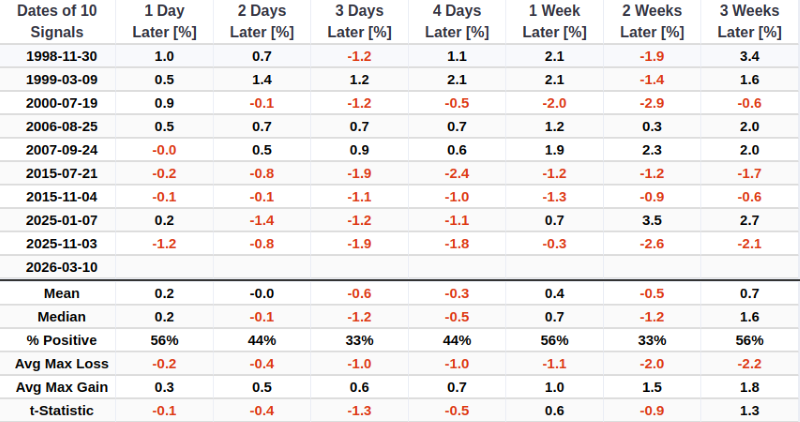
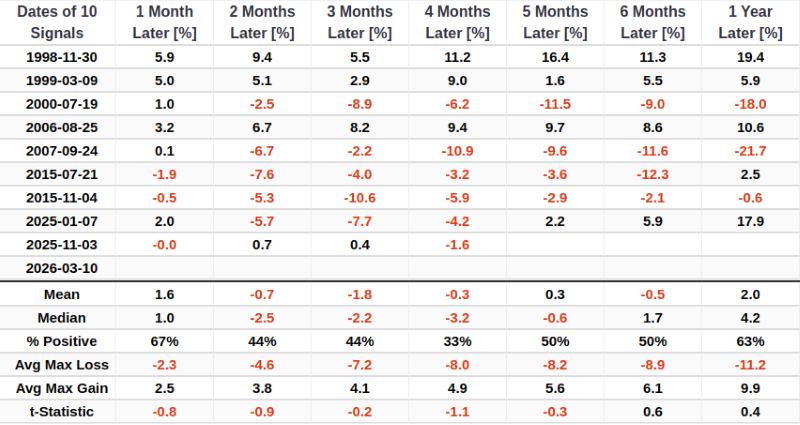
Over a two to four-month period, the average return is negative, and the average maximum loss exceeds the maximum gain across all timeframes, reflecting a period of elevated risk.
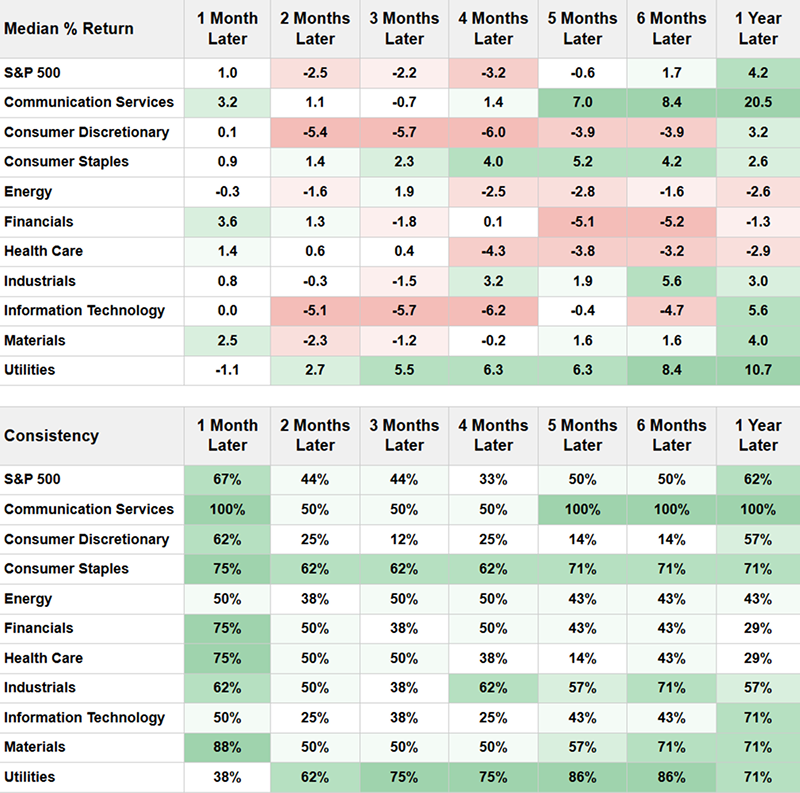
Following this signal, cyclical sectors have historically underperformed defensive sectors.
The context of deteriorating market breadth
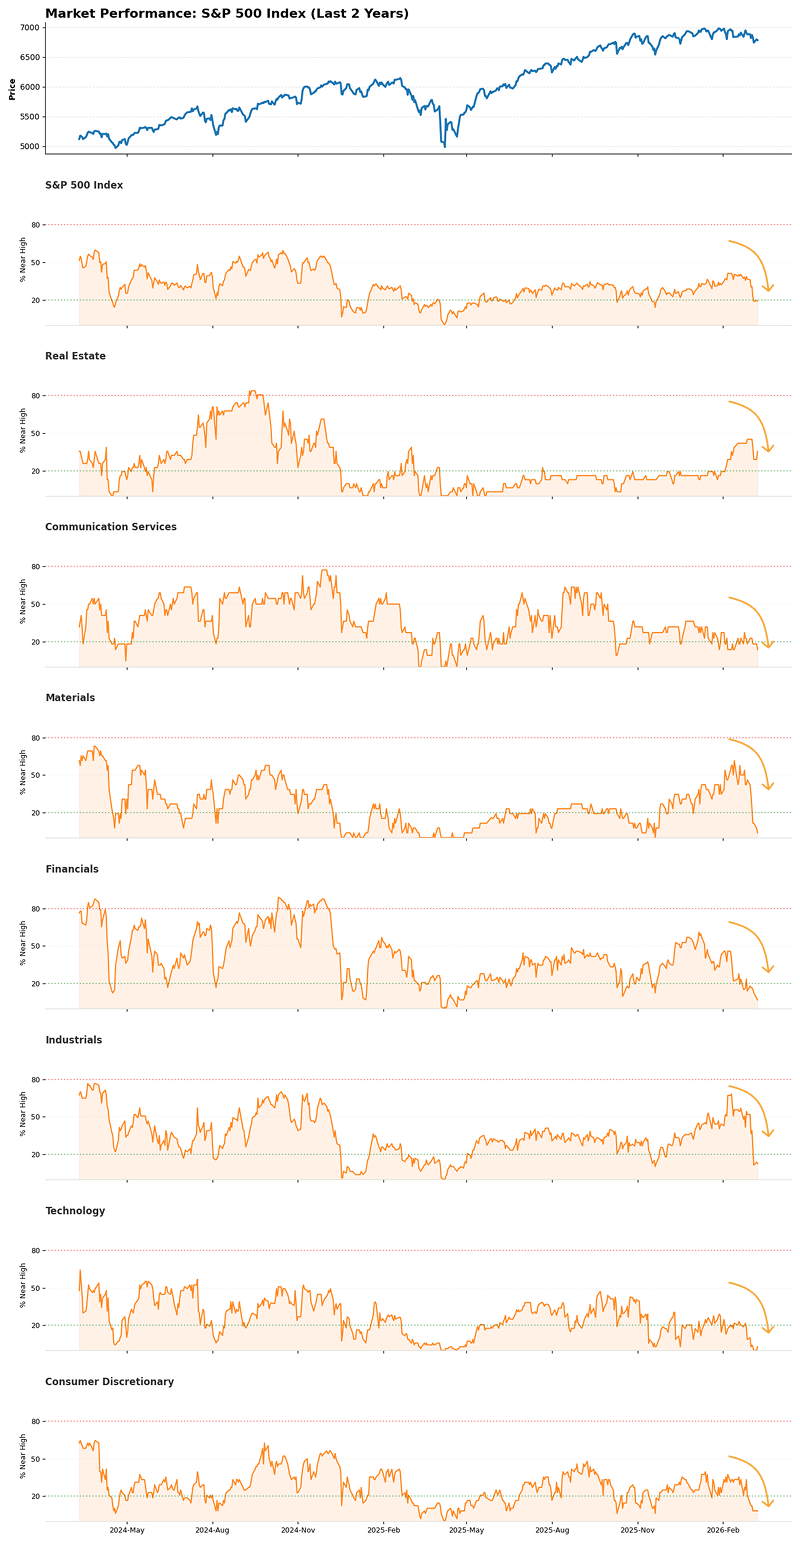
While the Energy sector maintains a healthy posture, this underlying weakness in the broader market is evident across other sectors, such as Financials, where currently only 7% of constituents are trading within 5% of their one-year highs. The chart below illustrates the percentage of component stocks within selected cyclical sectors whose prices are within 5% of their one-year highs.
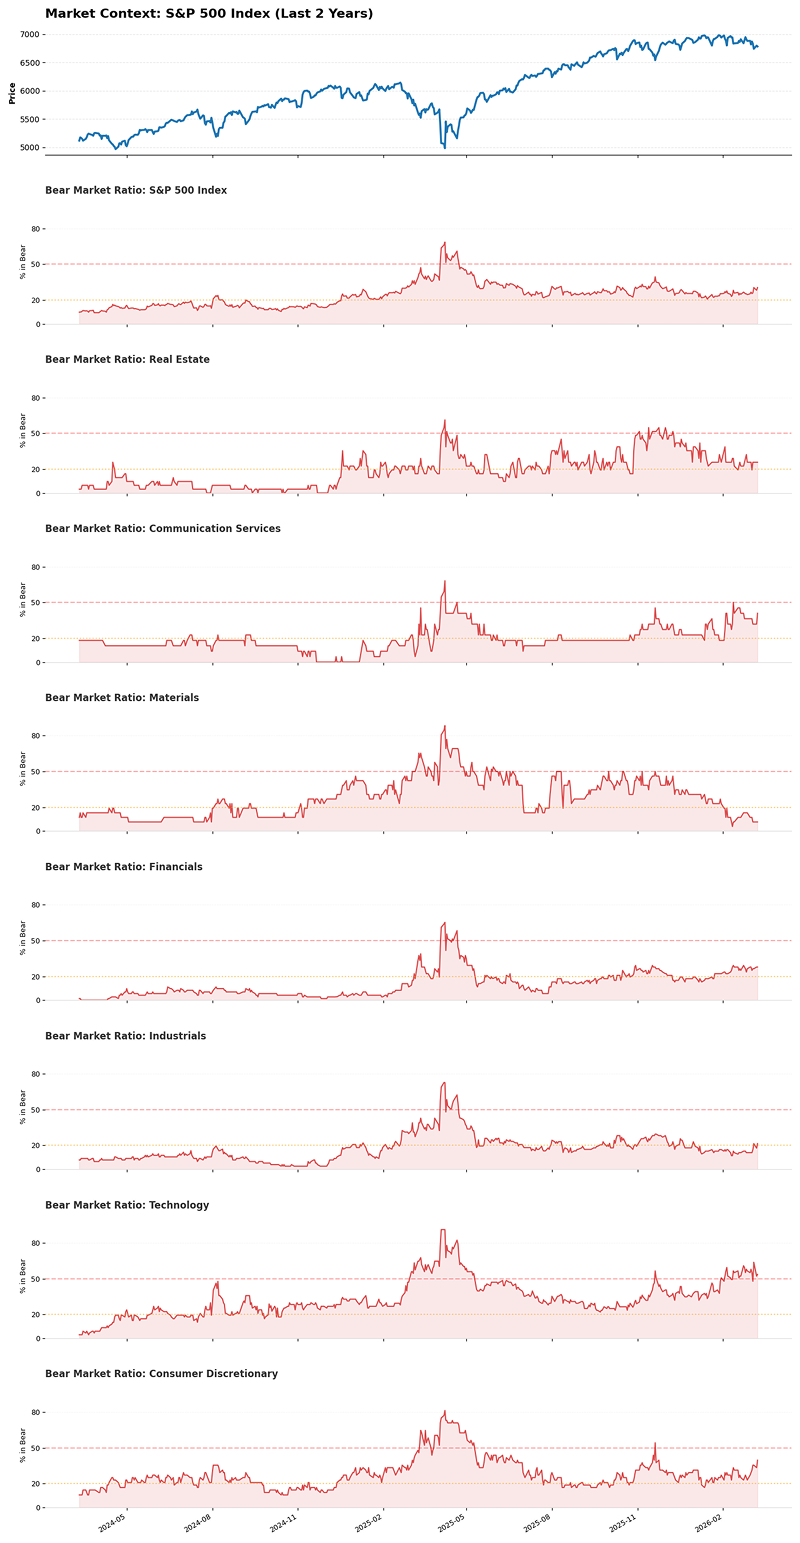
Intensifying market stress is pushing more stocks into bear market territory-defined as a 20% decline from their 252-day highs. The chart below displays the proportion of component stocks within selected sectors that are in bear market territory. In a healthy bull market, the red area for all sectors should be close to zero. If the red areas for cyclical sectors like XLF (Financials) and XLI (Industrials) begin to expand simultaneously, it is often a signal of an impending economic recession.
Further evidence of vulnerability
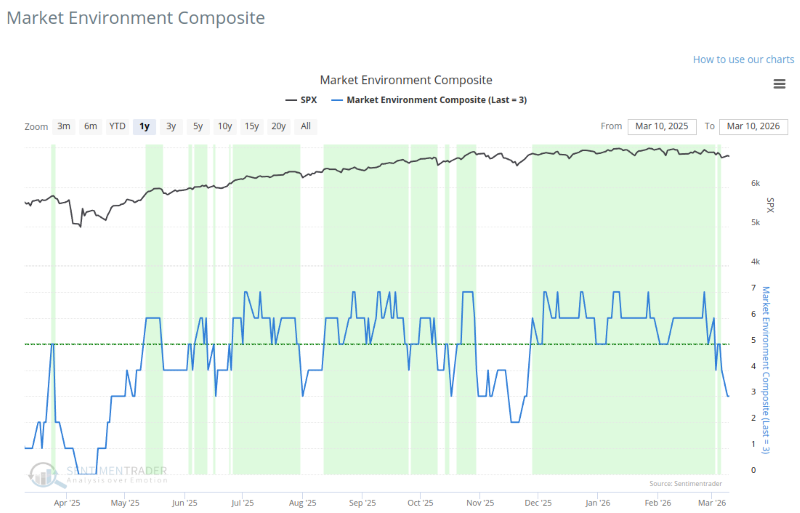
The Market Environment Composite is currently hovering right at the "unhealthy" level. In an unhealthy market environment, future returns tend to be weak, and risks are elevated.
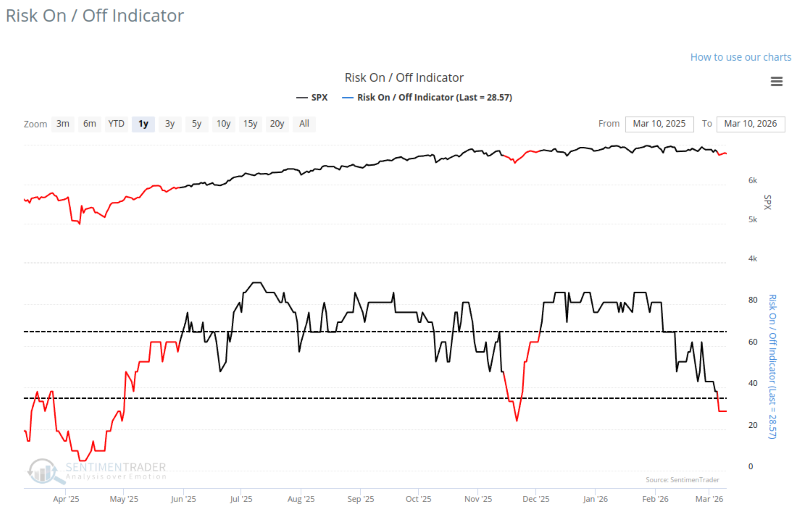
The Risk On/Off Indicator remains in a "Risk-Off" state. As noted in previous articles, a risk-off state suggests the stock market is likely to experience short-term weakness.
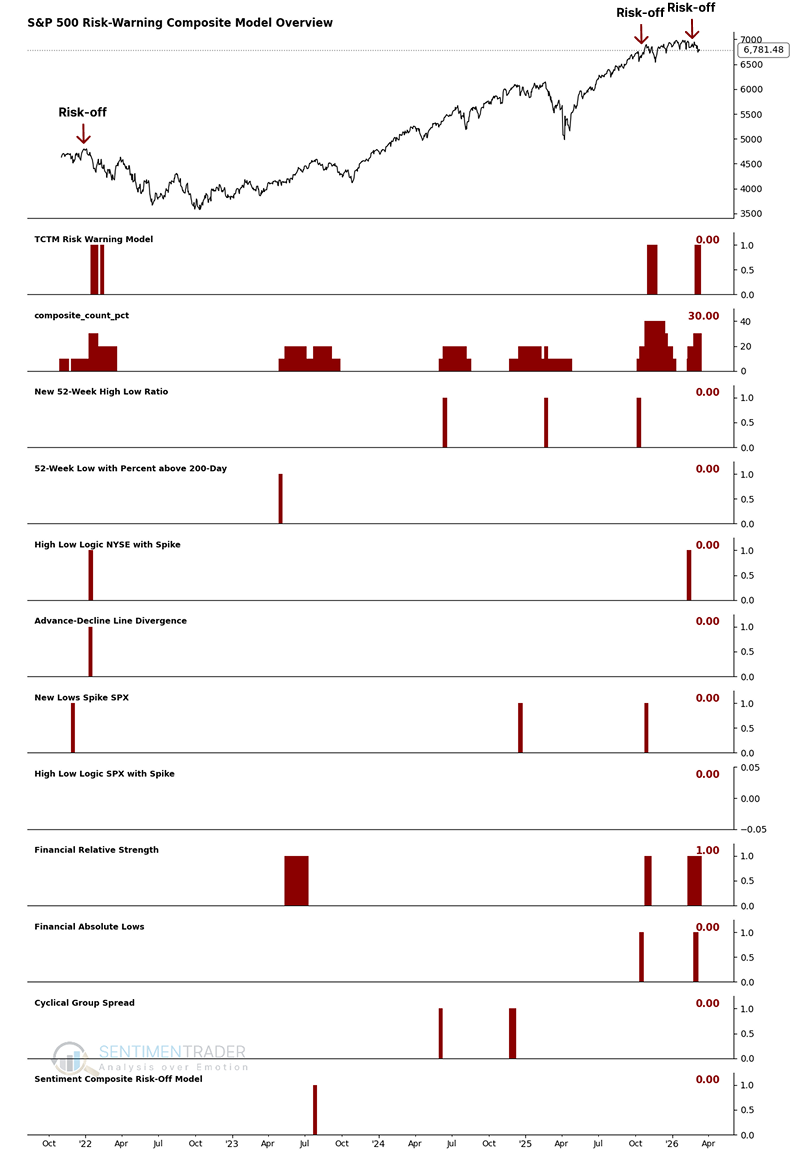
The S-TCTM Risk Warning Model transitioned from 1 to 0 on March 10th. Following the Risk Warning signal, the S&P 500 typically faces higher volatility, greater downside risk, and a challenging market environment.
What the research tells us...
The divergence between the S&P 500's price action (near record highs) and its internal breadth (fewer than 55% of stocks above their 200-day MA) is a classic late-cycle warning sign. While beneath the surface, cyclical sectors like Financials and Industrials are showing alarming signs of weakness, with many constituents sliding into bear market territory. With our composite Market Environment and Risk On/Off models confirming this fragile state, the weight of the evidence suggests a high-risk environment. Investors should anticipate elevated volatility and downward pressure in the near term, favoring defensive positioning over aggressive risk-taking.
Please note that historical performance does not guarantee future results, as macroeconomic contexts and market conditions constantly evolve. Any indicator or model is subject to failure. We recommend monitoring for signs of a reversal closely and evaluating them within the context of your own risk tolerance and investment strategy.