
Long-term Treasury bonds trigger an Optimism Index buy signal

Key points:
- A trading model that uses the Optimism Index triggered a buy signal for the 20+ Year Treasury Bond ETF
- After other alerts, long-term Treasury bond prices increased, especially after corrections
- The case for bonds looks more constructive, with inflation trending lower
Should we catch the falling knife in long-term bonds
With inflation surging to the highest level in 40 years, bond investors have endured the worst start to a year in history. A popular bond trading vehicle, the 20+ year Treasury bond ETF (TLT), is down almost 32% year-to-date.
However, the recent CPI report showed inflation has potentially peaked, and bond traders responded by bidding up Treasury prices across the curve. The reversal triggered a new Optimism Index buy signal for the 20+ Year Treasury Bond ETF on Tuesday.
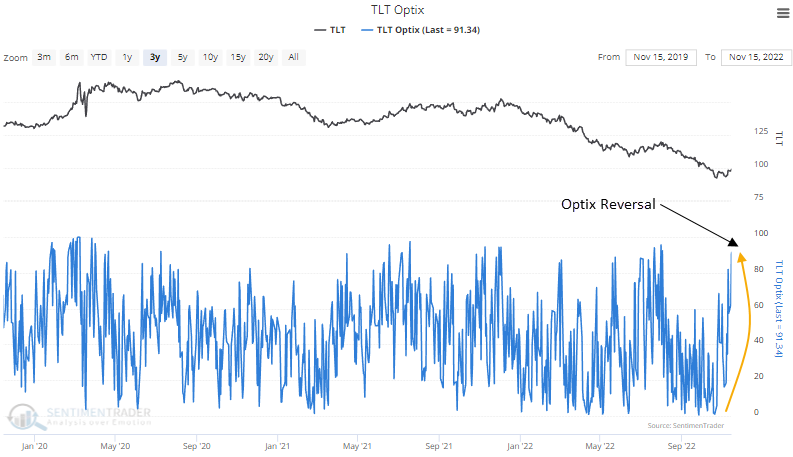
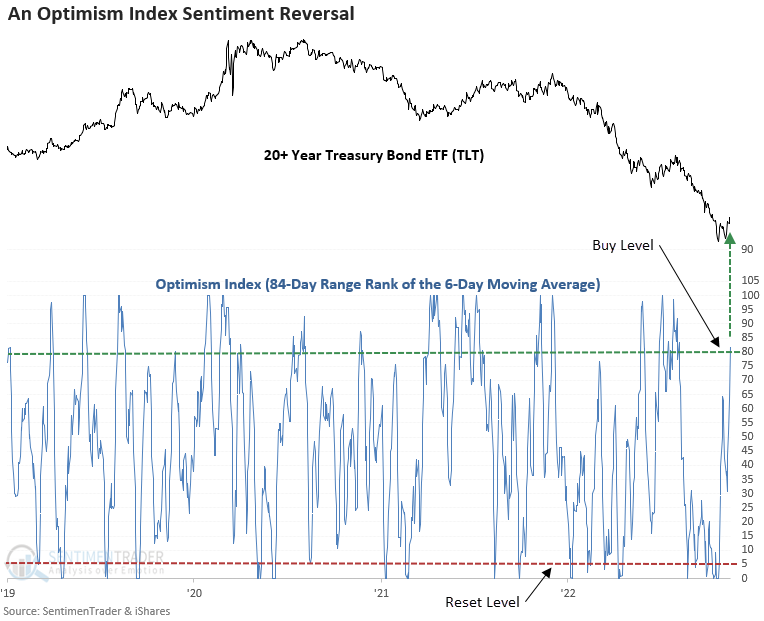
A trading model that identifies a reversal in the Optimism Index
The model applies an 84-day range rank to the 6-day moving average of the Optimism Index for the TLT ETF. The range rank indicator measures the current value relative to all other values over a lookback period. 100 is the highest, and 0 is the lowest. The pessimistic reset condition occurs when the range rank for the Optix Index crosses below the 5th percentile. A new buy signal triggers when the range rank exceeds the 80th percentile, and ETF momentum turns positive.
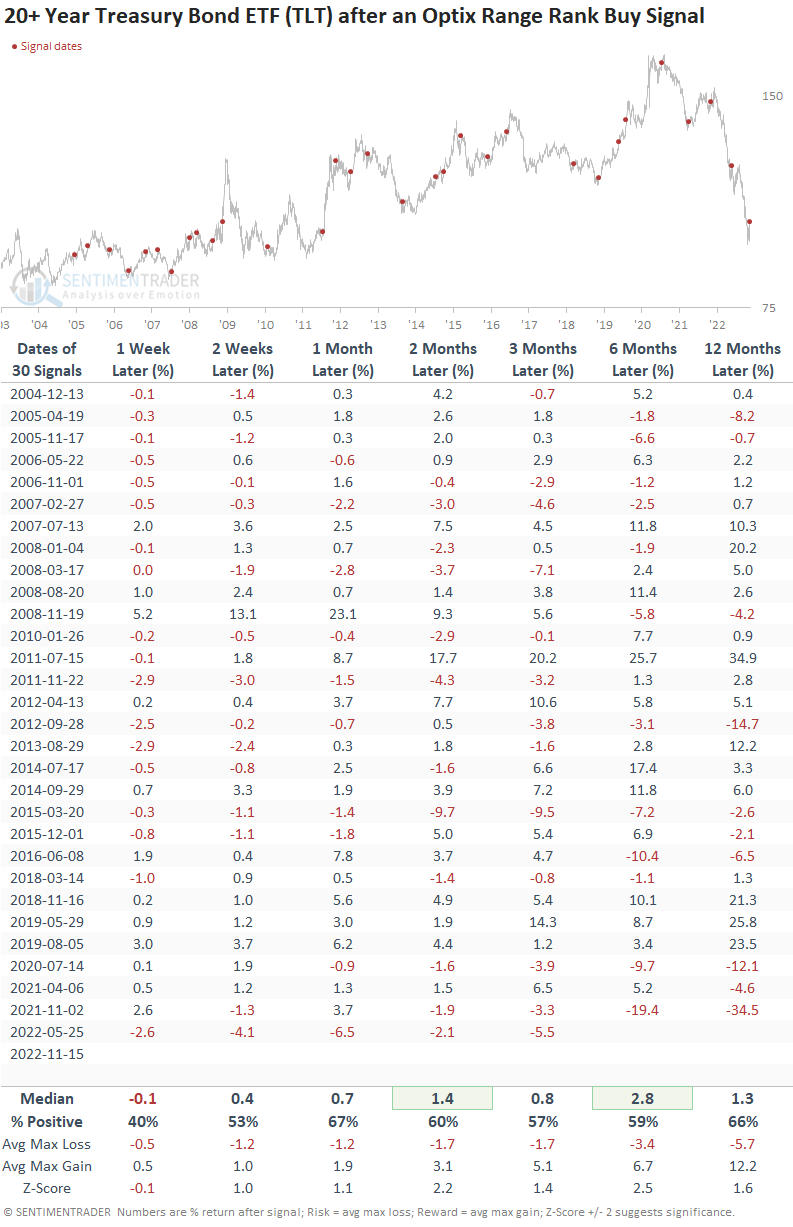
The TLT ETF rallied 60% of the time after other signals
While a couple of time frames show a significant z-score, the win rates and returns are okay. Usually, the ETF undergoes a little digestion in the first week. Whenever a trading alert occurs for one of my models, I investigate further to see if I can find additional evidence to support the case for a potential trade or investment.
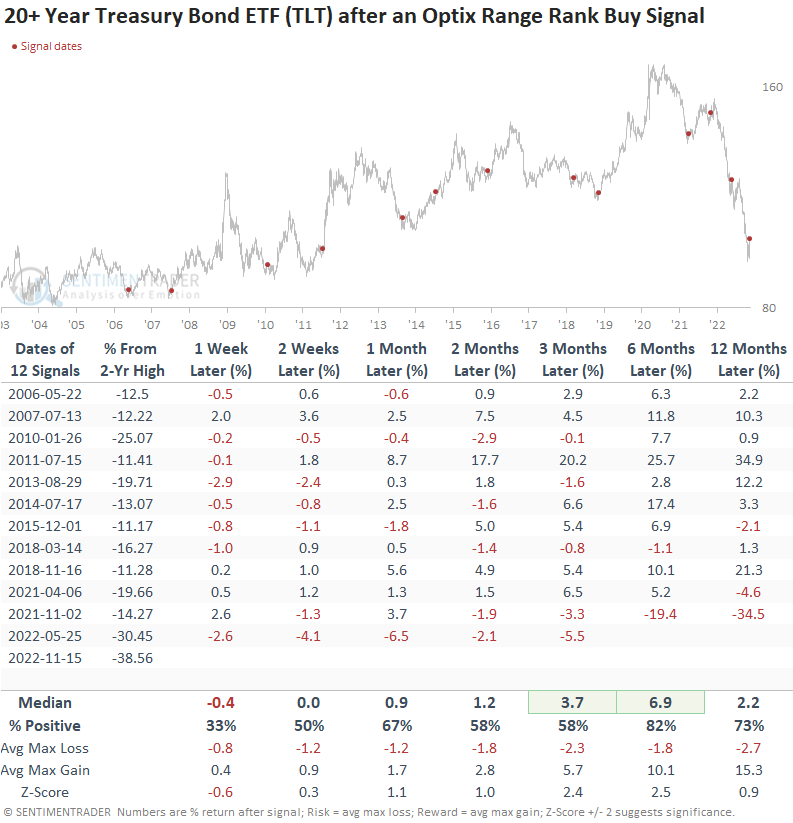
Context is always important. So, let's isolate all signals that occurred when the TLT ETF was down 10% or more from a 2-year high, which is the case now. While the first couple weeks are challenging, the outlook improves dramatically, especially six months later.
A decline in inflation would be a welcome development for bond investors
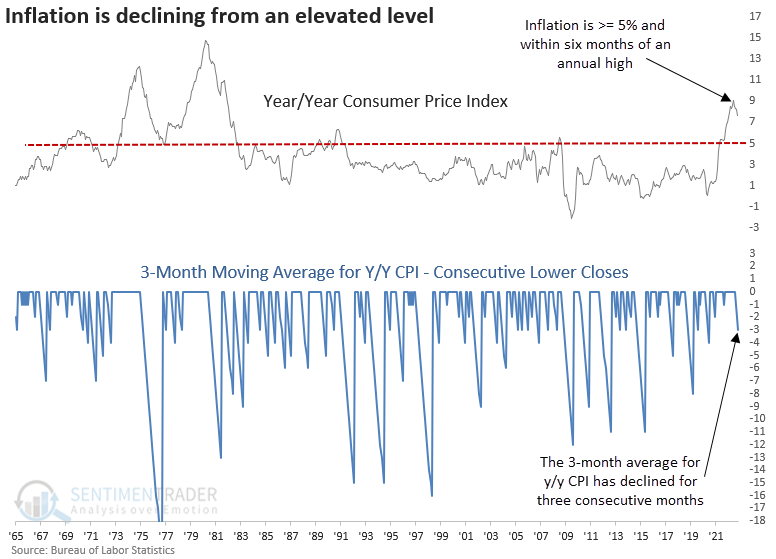
With the release of the latest CPI report last week, the 3-month moving average of the y/y change in CPI declined for the third straight month. The successive month's lower for the average occurred with y/y CPI above 5% and within six months of an annual high.
While the sample size is small, as with most studies when inflation is this high, the outlook suggests the 10-year bond yield could trend lower over the following year.
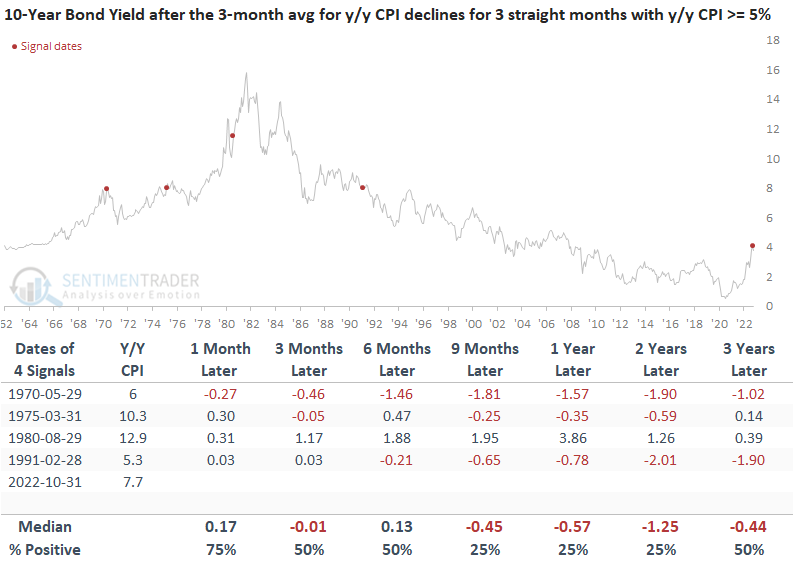
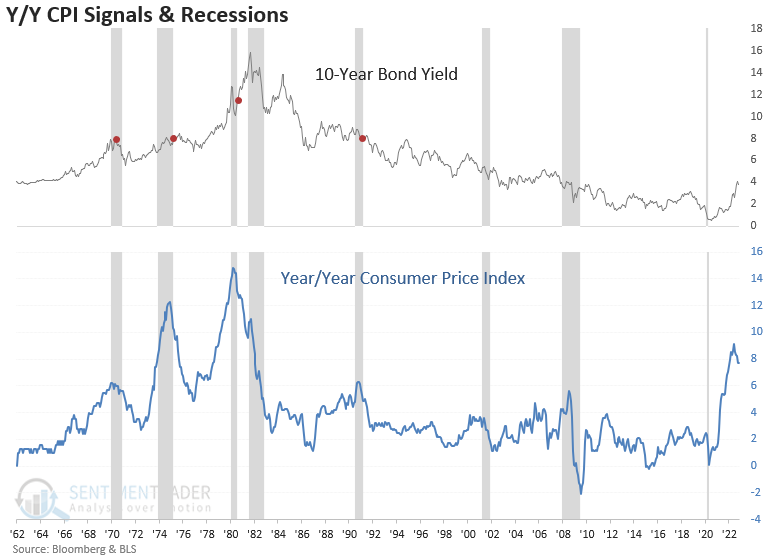
Long-term bond yields could move lower due to a recession. The CPI signals triggered near an economic contraction in 3 of 4 cases. With the 10-year to 3-month Treasury yield curve spread at -54 basis points, a level not seen since March 2007, a recession looks more likely.
What the research tells us...
Like other long-duration investments, long-term bonds have been annihilated this year as inflation continued to creep higher, forcing the Federal Reserve to tighten monetary policy at one of the fastest paces in history. However, the most recent CPI report suggests we may have seen a peak in inflation. With a potentially better environment for bond investors, a trading model that uses the proprietary SentimenTrader Optimism Index triggered a new buy signal for the 20+ Year Treasury Bond ETF (TLT).