Products
SentimenTrader Trading Tools
‍
Backtest Engine
My Trading Toolkit
Correlation Analysis
Seasonality
Indicators & Data API
‍
Proprietary Indicators & Charts
Market Data API
Strategies & Scanner
‍
50+ Trading Strategies
Smart Stock Scanner
Research Reports
‍
Research Solutions
Reports Library
Free Resources
Simple Backtest Calculator
Simple Seasonality Calculator
The Kelly Criterion Calculator
Sentiment Geo Map
Public Research Reports
Pricing
Company
About
In the News
Testimonials
Client Success Stories
Contact
Log inLoginSign up
< BACK TO ALL REPORTS

Leverage declines as margin debt plunges again

Jason Goepfert
2020-04-28
Investors pulled back on leverage in March, with margin debt declining more than 10% that month alone, one of the biggest declines for a single month in decades. Debt is now down more than 25% from its peak, which is large but not to the level of the most severe declines.

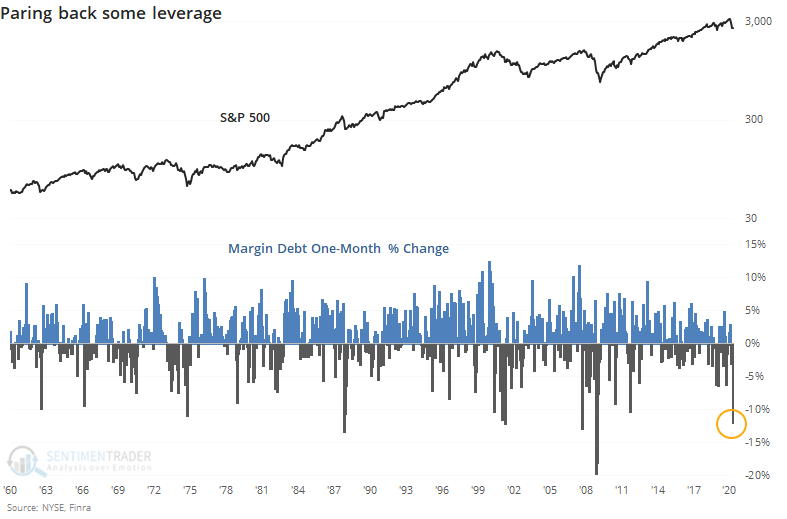
A market crash will usually prompt folks to pare back their leverage. Based on figures from March, the virus sparked just that behavior, as investors' debt borrowed against stock holdings plunged 10%.

That's one of the largest one-month declines in margin debt in history, especially over the past 60 years when the data became less volatile.

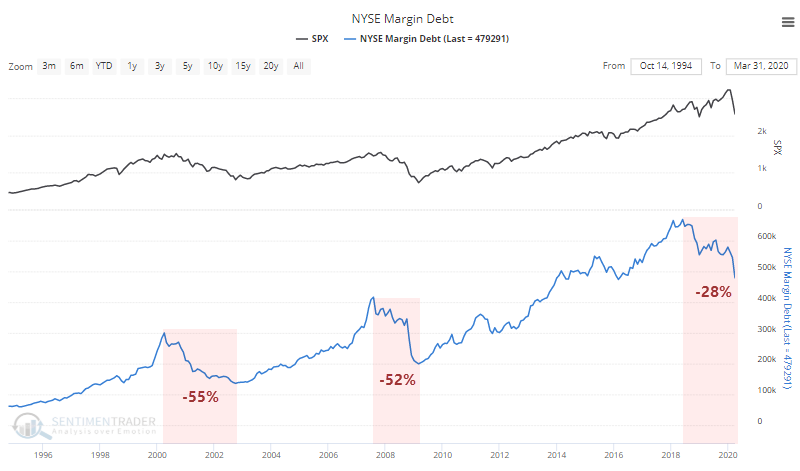
Since margin debt peaked in 2018, it has declined by more than 25%. It looks like a big decline on a chart but is only a little more than half of the decline seen during the last two protracted bear markets.

Even so, a drop of 25% from a peak is historically deep.

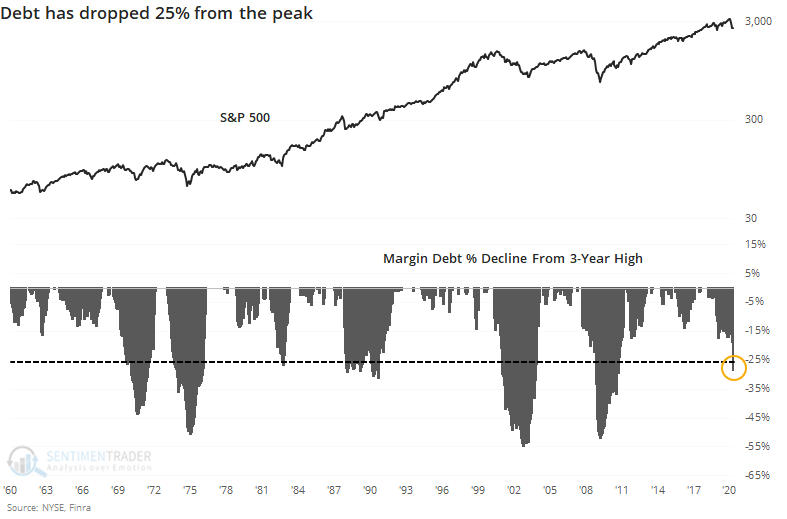
This has had a mixed record of being enough of a drop in leverage. The worst of the declines stopped when debt contracted by 40% - 50%, with some of the lesser market drops leading to a smaller drop in leverage.

When the drop in margin debt first hit 25%, it had a mixed record of future returns in the S&P 500. Since the figures are released with a delay, the dates in the table are as of the next month. For example, the debt decline first hit -25% in October 2008, but we wouldn't know that right away, so November 2008 is used to calculate forward returns.

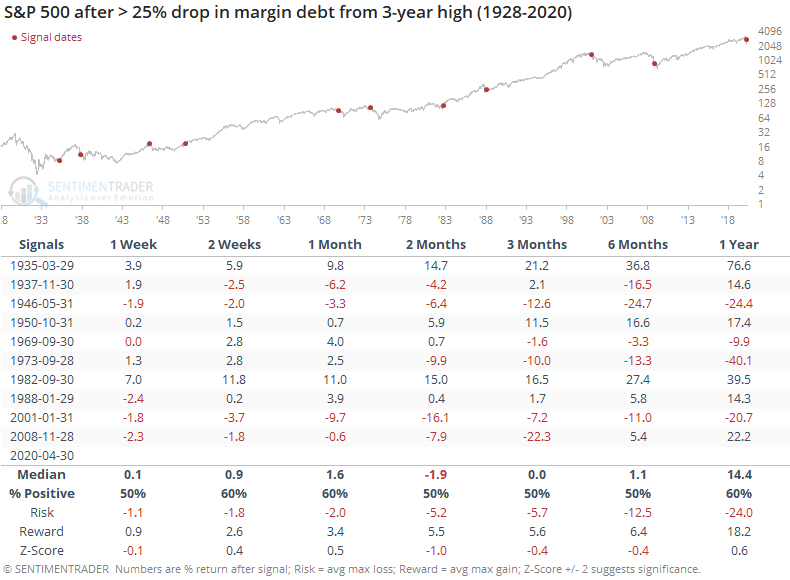
The data is less reliable the further back we go, so it makes sense to place a heavier weight on more recent signals. And in that case, returns over the next 2-3 months weren't great, especially over the next 2-3 months. The drop in 1982 was about the worst of it, so forward returns were excellent. Other than that, recent decades showed either a loss or small gain.

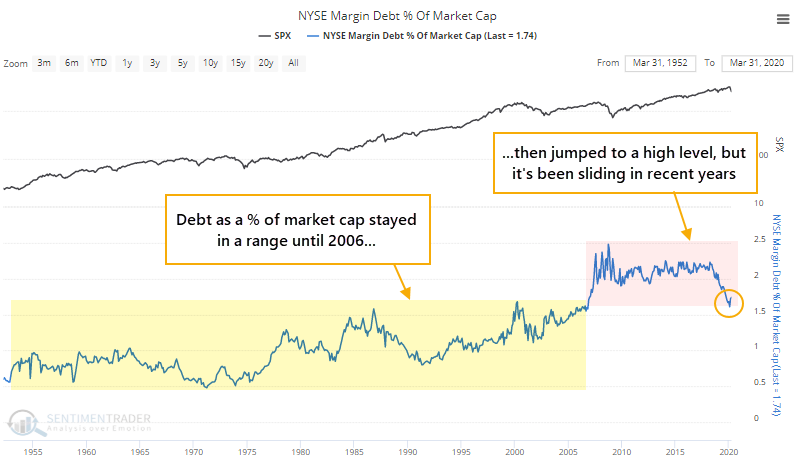
As a percentage of the total market capitalization of U.S. stocks, debt stayed in a somewhat stable range for decades, then broke out in 2006 as investors took out loans against their stock holdings to a degree never seen before. That has been dropping in recent years, and recently hit a 13-year low. It ticked up a bit in March because market cap fell more than margin debt did.

Margin debt is one of those indicators that both bulls and bears like to use when it supports their argument. The fact is that it's an inconsistent data set that mostly just tracks the market itself. The fact that it has dropped by more than 25% isn't enough to suggest a washout, and if anything it's a very slight negative for the months ahead.

Sorry, you don't have access to this report

Upgrade your subscription plan to get access
Go to Dasboard
PRODUCTS
SentimenTrader
Trading Tools
Indicators & Data API
‍
Strategies & Scanner
‍
Research Reports
FREE
RESOUrCES
Simple Backtest
Calculator
Simple Seasonality
Calculator
The Kelly Criterion
Calculator
Sentiment Geo Map
‍
Public Research Reports
‍
Pricing
Bundle pricing
‍
Announcements
‍
FAQ
COMPANY
‍
About
‍
In the News
‍
Testimonials
‍
Client Success Stories
CONTACT
‍
General Inquiries
‍
Media Inquiries
‍
Financial Professionals Inquiries
‍
© 2025 Sundial Capital Research Inc. All rights reserved.
Setsail Marketing
TermsPrivacyAffiliate Program
Risk Disclosure: Futures and forex trading contains substantial risk and is not for every investor. An investor could potentially lose all or more than the initial investment. Risk capital is money that can be lost without jeopardizing ones’ financial security or life style. Only risk capital should be used for trading and only those with sufficient risk capital should consider trading. Past performance is not necessarily indicative of future results.

Hypothetical Performance Disclosure: Hypothetical performance results have many inherent limitations, some of which are described below. No representation is being made that any account will or is likely to achieve profits or losses similar to those shown; in fact, there are frequently sharp differences between hypothetical performance results and the actual results subsequently achieved by any particular trading program. One of the limitations of hypothetical performance results is that they are generally prepared with the benefit of hindsight. In addition, hypothetical trading does not involve financial risk, and no hypothetical trading record can completely account for the impact of financial risk of actual trading. for example, the ability to withstand losses or to adhere to a particular trading program in spite of trading losses are material points which can also adversely affect actual trading results. There are numerous other factors related to the markets in general or to the implementation of any specific trading program which cannot be fully accounted for in the preparation of hypothetical performance results and all which can adversely affect trading results.

Testimonial Disclosure: Testimonials appearing on this website may not be representative of other clients or customers and is not a guarantee of future performance or success.