
Less oil volatility and surging agriculture
Oil has calmed down over the past few months after the worst plunge in history. This can be seen via oil's 4 month range, which we can define as the (max $ - min $ over the past 4 months) / (max $). This range spiked as oil crashed and has since calmed down.
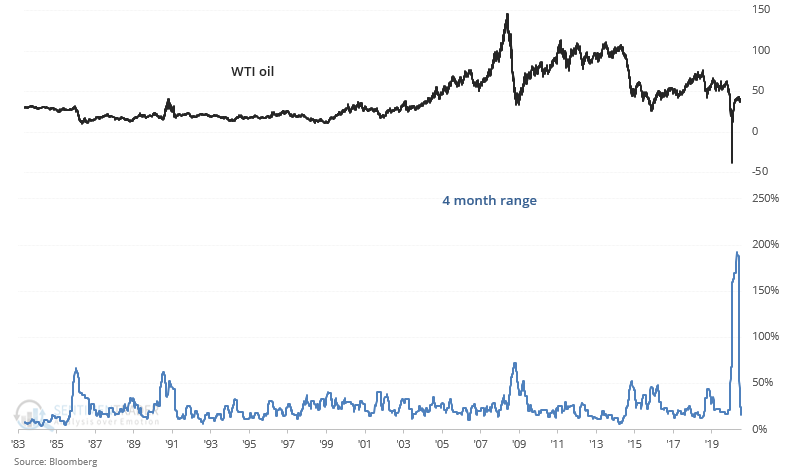
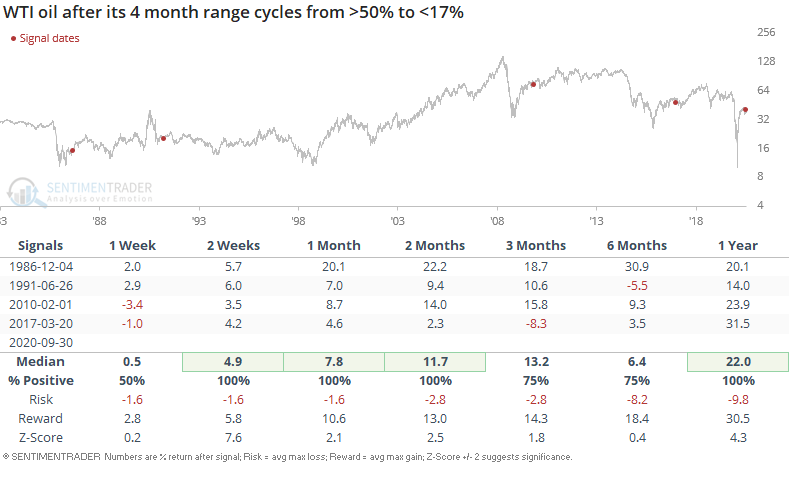
When oil's 4 month range spiked and then subsided (i.e. after a crash), it typically rallied further in the months and years ahead. The 4 month historical periods of low volatility acted as a brief consolidation before oil rallied higher.
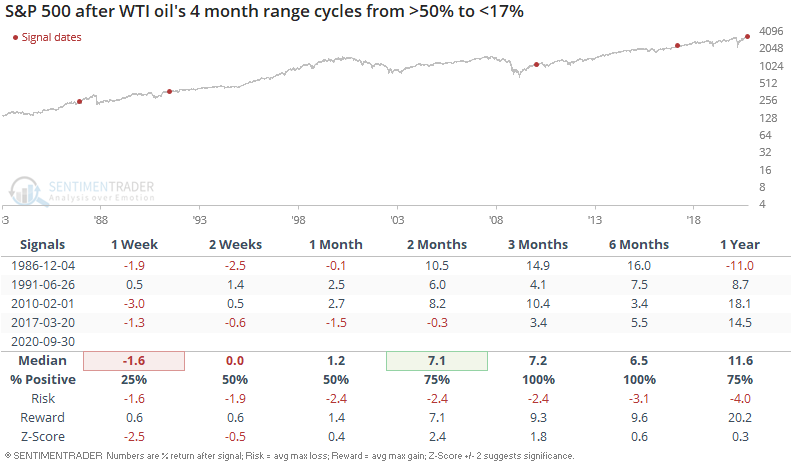
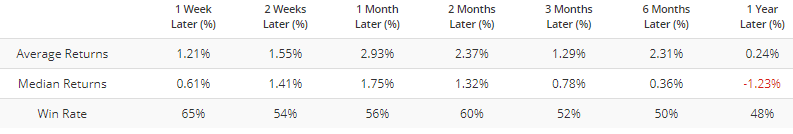
Here's what the S&P 500 did next:
Various commodities have rallied recently, with the most often cited reason being "reduced supply and inventories". Soybean Optix's 20 dma is at the highest level in years (74):
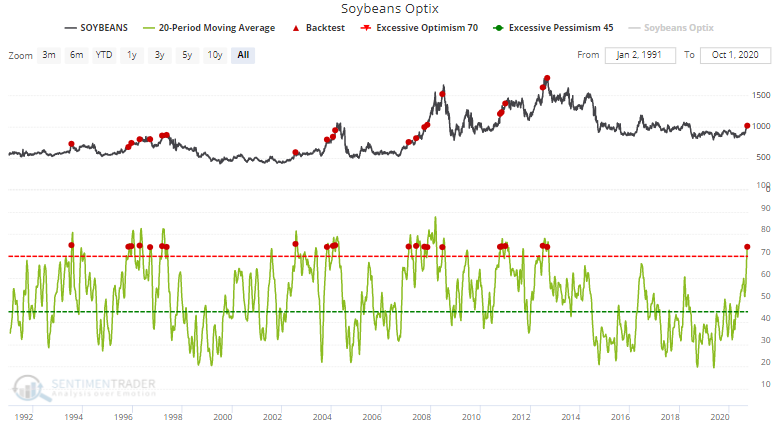
When soybean sentiment was this high in the past, soybean could rally further in the short term. However, it typically fell over the next year:
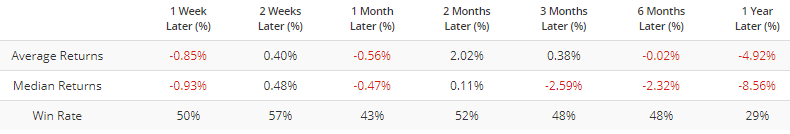
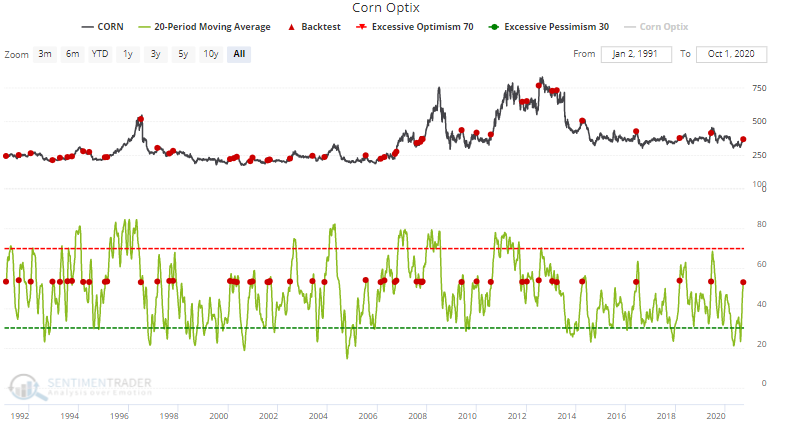
Sentiment in other commodities is increasing, but not as high as what we've seen in soybeans. For example, Corn Optix's 20 dma is at 53:
In the past, this led to mixed returns going forward:
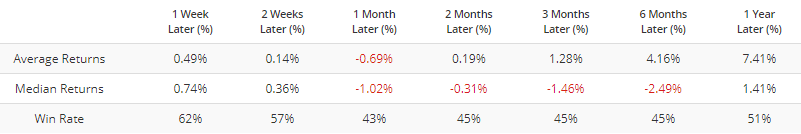
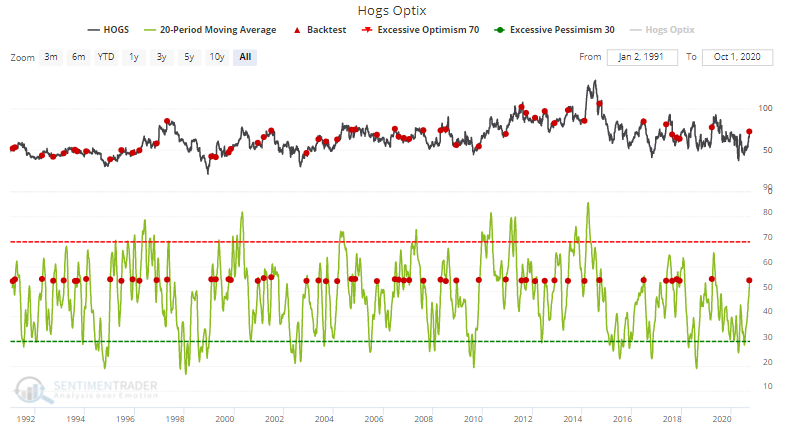
Hogs Optix's 20 dma is at 54 (surging Chinese pork prices?):
Once again, this led to mixed forward returns:
And lastly, bond market volatility remains at an all-time low. Could this lead to a sharp ramp higher in bond market volatility, followed by a stock market crash?
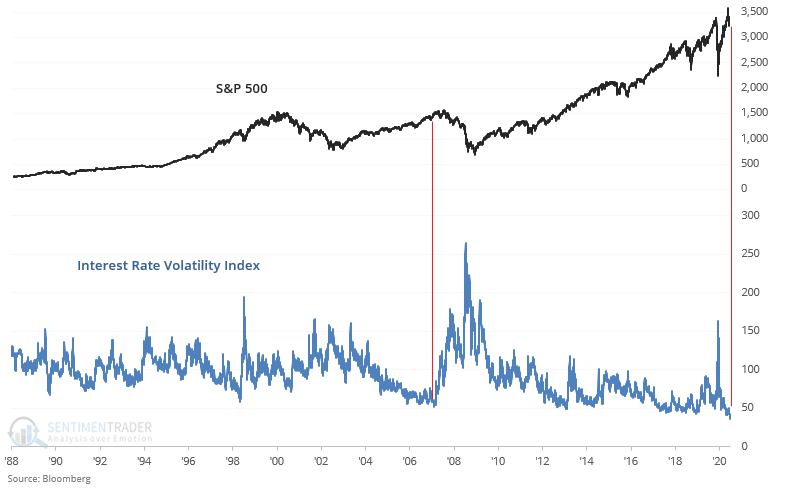
I wouldn't put much weight on these charts. They're great for telling a hype-y narrative, but the fact is simple. These charts cherry pick the bottom, when in reality you only know the bottom in bond market volatility with 20/20 hindsight!