
Leading indicators offer a clue for real estate

Key points
- The Conference Board Leading Economic Indicators index had been in a downtrend for two and half years
- One measure of this index has now turned favorable
- Historically, this development has had an outsized impact on the real estate sector
The real estate sector has been a laggard
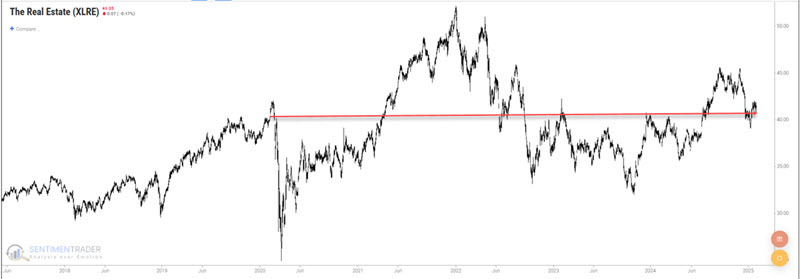
To measure the performance of the real estate sector in the tests below, we will use the Fama French Index database from 1959 to 1991 and then the S&P 500 Real Estate sector after that. The Real Estate Select Sector SPDR Fund (ticker XLRE) tracks this index. The chart below displays price action for ticker XLRE. Note that it is essentially unchanged from its level of five years ago (a period which saw the S&P 500 more than double in value).
The chart below highlights the real estate sector's massive underperformance. The top clip displays price action for ticker XLRE (black line) and ticker SPY (which tracks the S&P 500; blue line). The bottom clip displays XLRE's relative performance vs. SPY.
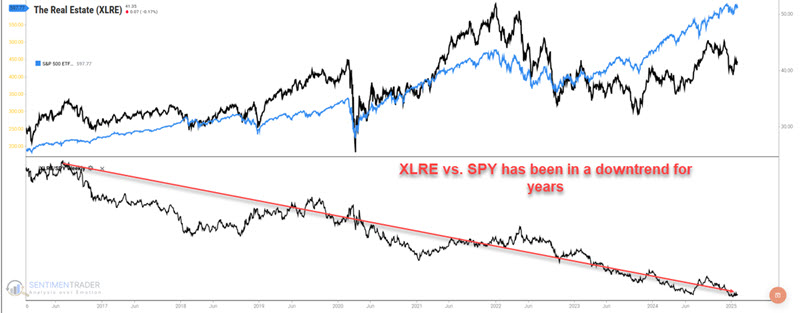
Is it time to "pick the bottom" in this relationship? Not necessarily. However, the real estate sector is especially sensitive to the overall economy's trend. The recent uptick in the leading economic indicators strongly suggests the potential for better days ahead for the sector.
Measuring real estate sector performance based on economic trends
To gauge the state of the economy, we will use The Conference Board Index of Leading Economic Indicators (LEI). We will rate LEI performance based on two different measures as described below:
A = LEI this month
B = 12-month exponential moving average (EMA) of A
C = 6-month simple moving average of A
D = 6-month simple moving average of A last month
E = A - B (latest LEI minus 12-month EMA)
F = C - D (this month's six-month average minus last month's six-month average)
G = If E > 0 then G = 2 else G = 0
H = If F > 0 then H = 1 else H = 0
In plain English, if the latest LEI reading is above its 12-month EMA, we add two points, and if the latest LEI 6-month simple moving average rose in the last month, we add another point.
Let's next create an indicator that combines the two. We will call the indicator LEIsum. Its value is calculated as follows:
- LEIsum = G + H
Note that LEI values are reported with a one-month lag and that I only perform the above calculations at the end of the month. So, the December 2024 LEI value was reported sometime during January 2025, and I updated the indicators above on January 31st.
The LEIsum value can equal 3, 2, 1, or 0 each month, as shown in the chart below, which displays the month-end LEIsum readings since 1959.
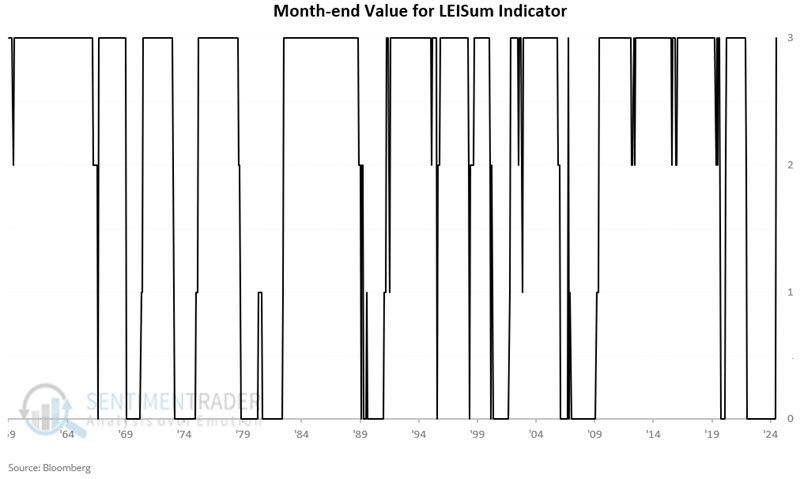
NOTE: The LEISum indicator is not currently available on the Sentimentrader.com website. I do plan to coordinate with our programming team to have them added soon (and perhaps give it a better name).
The latest results
The December 2024 reading for LEI is 101.6, and the 12-month EMA is 101.45. The 6-month simple moving average for December is 100.18, and the 6-month simple moving average for the prior month was 110.10.
So, on January 31st:
A = 101.60 (LEI this month)
B = 101.45 (12-month exponential moving average (EMA) of A)
C = 100.18 (6-month simple moving average of A)
D = 100.10 (6-month simple moving average of A LAST month)
E = 101.60 - 101.45 = 0.15 (latest LEI minus 12-month EMA)
F = 100.18 - 100.10 = 0.08 (C - D)
G = 2 (If E > 0 then G = 2 else G = 0)
H = 1 (If F > 0 then H = 1 else H = 0)
So, as of 2025-01-31, the value for LEIsum = 3 for the purposes of trading XLRE (or any other real estate ETF such as IYR, VNQ, REM, and others).
Does it matter? Peruse the results below and decide for yourself.
LEIsum readings of +3 are bullish
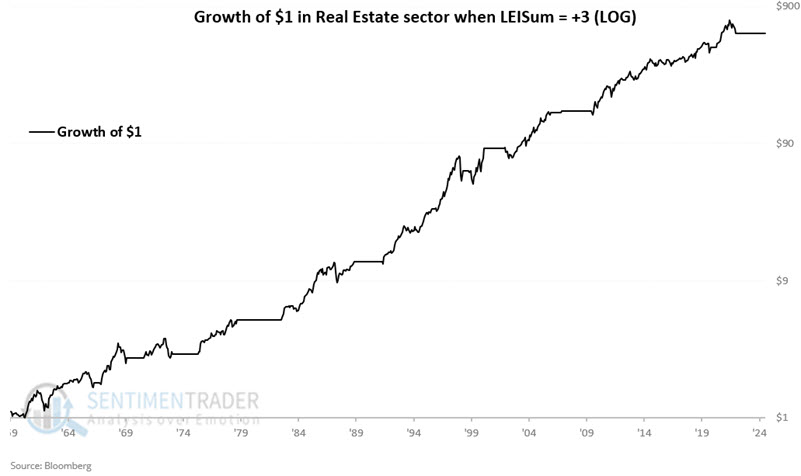
The chart below displays the cumulative growth of $1 invested in the real estate sector only during those months when LEIsum ended the previous month with a reading of +3. The chart is presented on a logarithmic scale. The cumulative hypothetical gain from October 1959 through January 2025 was +57,122%.
The table below displays the action of the real estate sector during previous LEISum = +3 periods.
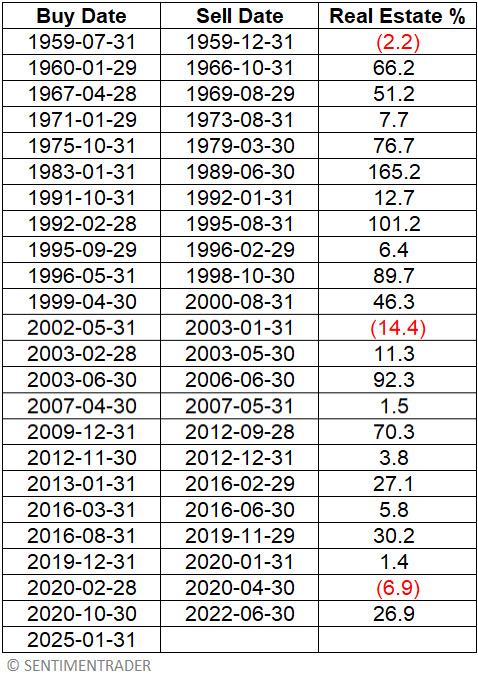
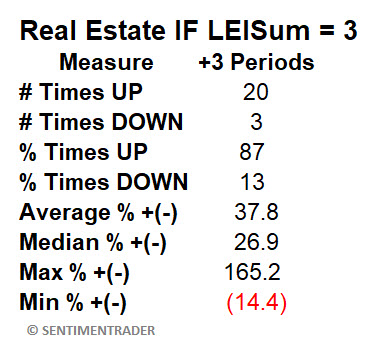
The table below summarizes performance results for all periods shown in the table above.
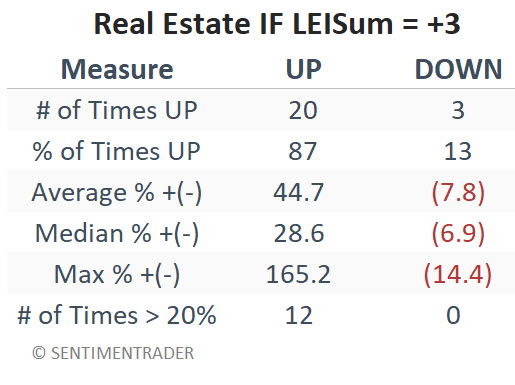
The table below breaks out performance for winning and losing periods in the first table.
The -14.4% loss during the 2002-2003 +3 period reminds us that there are never any "sure things" in the market. Despite that caveat, the results above show that the real estate sector tends to perform quite well when the economy is perceived to be on the upswing.
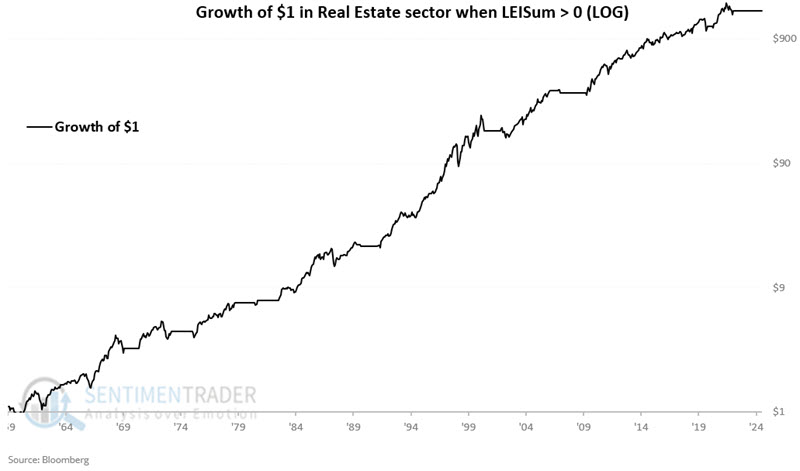
Any LEIsum reading above 0 is favorable
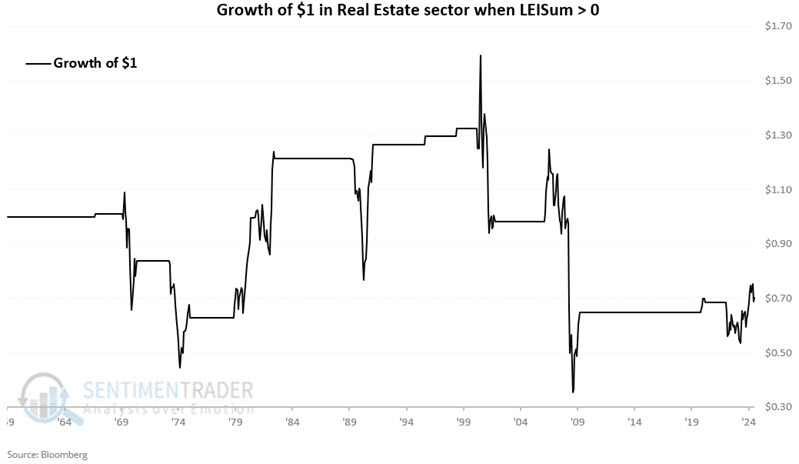
The chart below displays the cumulative growth of $1 invested in the real estate sector only during those months when LEIsum ended the previous month with a reading greater than 0 (i.e., +1, +2, or +3). The chart is presented on a logarithmic scale. The cumulative hypothetical gain from October 1959 through January 2025 was +152,443%.
Use extreme caution in real estate when LEIsum = 0
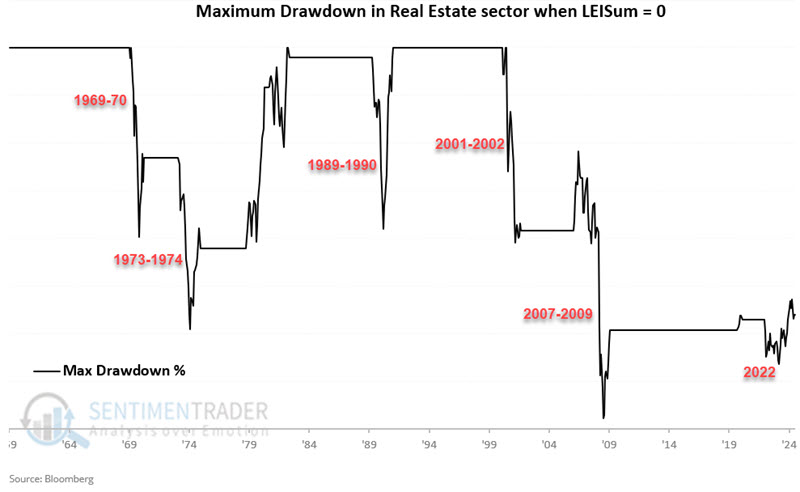
The chart below displays the cumulative growth of $1 invested in the real estate sector only during those months when LEIsum ended the previous month with a reading equal to 0.
Notice any difference between this chart and those above? Essentially, every primary bear market in the real estate sector occurred when LEIsum was equal to 0. The hypothetical cumulative return from October 1959 through January 2025 was (-29.8%).
A period from 1979 into 1982 saw real estate show a massive gain even in the face of a foundering economy. While making money is typically objective #1, avoiding devastating losses and preserving capital is also important. Standing aside real estate when LEIsum stood at zero would have allowed investors to avoid a drawdown of -40% or more in 1969-70, 1973-1974,1989-1990, 2001, and 2008-2009 (as well as a lot of volatile sideways action in 2022).
What the research tells us…
The real estate sector is highly sensitive to the overall economy's trend. The recent uptick in the leading indicators suggests - but alas, never guarantees - better days ahead for the sector. Based on the new +3 reading for our LEISum indicator, investors might do well to (finally) start looking for a buying opportunity in the real estate sector.