
Leading Economic Indicators as a Stock Market Indicator

In the long run, the stock market's performance is tethered to that of the overall economy. If there is economic growth on the horizon, the stock market will move to higher ground in anticipation. If a slowdown, a recession, or worse appears to be in the offing, the stock market will invariably react badly.
The Leading Economic Indicators index compiled by and released monthly by The Conference Board does a pretty job of foreshadowing impending economic growth and contraction. As it turns out, it can also help handicap the likelihood of a stock market advance.
FINDING THE TREND
LEI data is reported each month by The Conference Board and is widely disseminated, typically during the second half of the month. For our purposes:
- Regardless of when the latest data is reported, we will evaluate the current status only at the end of the month
In this manner, it is not time-critical to know in advance when the latest report is coming out. We simply evaluate it once a month at the end of the month.
To identify the trend, we will use an exponential moving average and compare the latest monthly reading to the 11-month exponential moving average.
- If the current reading is ABOVE the 11-month EMA, then the economy is considered to be trending UP
- If the current reading is BELOW the 11-month EMA, then the economy is considered to be trending DOWN
The calculations for an 11-month EMA are included at the end of this article. For now, let's focus on the implications and not the process. The chart below displays the latest available readings at the end of each month (the dark line) starting in 1959 and the 11-month exponential moving average (the lighter line).
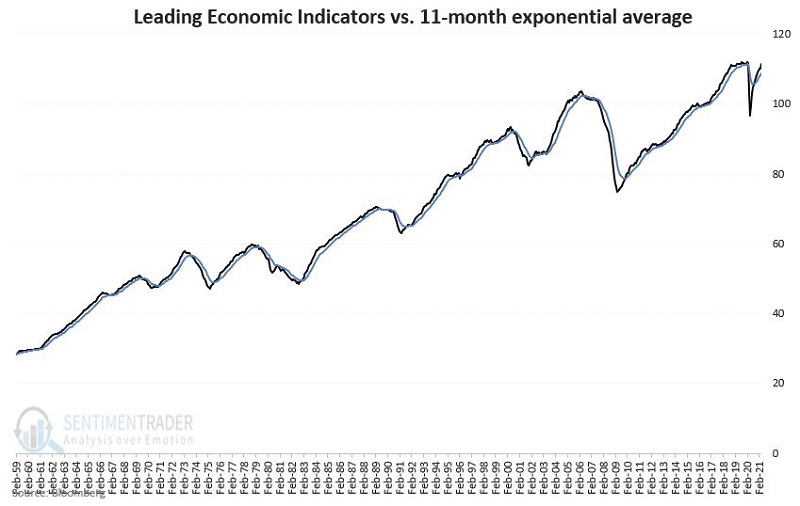
When the dark line in the chart above is greater than the lighter line, the overall economy's implication is considered favorable, and vice versa.
The chart below subtracts the 11-month exponential moving average from the latest monthly LEI reading so that the value in the chart fluctuates above and below 0.
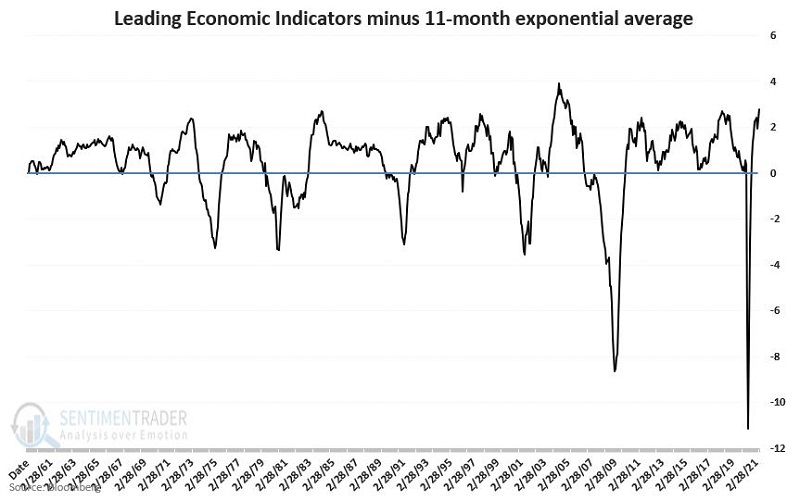
- If the value in the chart above is ABOVE 0, then the economy is considered to be trending UP
- If the value in the chart above is BELOW 0, then the economy is considered to be trending DOWN
THE IMPLICATIONS
Following the economy's trend is all well and good as an academic exercise, but the question that matters most to investors is, "What does it mean for the stock market?"
Since the stock market itself is typically considered a leading indicator of the economy, logically, if the indicator above is above 0, we should naturally expect the stock market to perform relatively better than if our indicator is in a downtrend. How has this simple theory worked out in practice? Let's take a closer look.
To test the theory, at the end of each month, we will assess the relationship between the latest LEI reading and its own 11-month EMA. We will then accumulate the gains or losses experienced by the S&P 500 Index in the following month based on whether the latest reading was bullish or bearish.
STOCK MARKET PERFORMANCE WHEN LEI IS TRENDING HIGHER
The chart below displays the cumulative price performance for the S&P 500 Index since 1959 during only those months when the LEI was in an established uptrend (i.e., ABOVE it's 11-month EMA) at the end of the previous month.
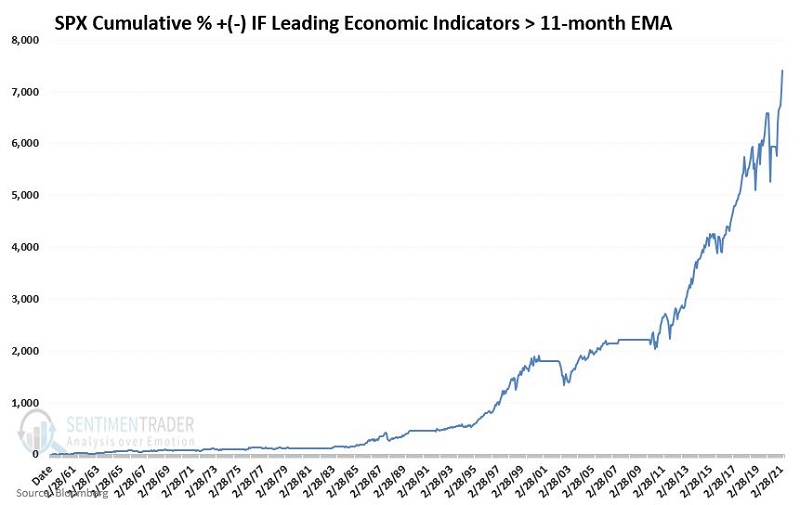
As you can see, overall, the trend is typically quite favorable, although there are inevitable downdrafts along the way.
STOCK MARKET PERFORMANCE WHEN LEI IS TRENDING LOWER
The chart below displays the cumulative price performance for the S&P 500 Index since 1959 during only those months when the LEI was in an established downtrend (i.e., BELOW its 11-month EMA) at the end of the previous month.
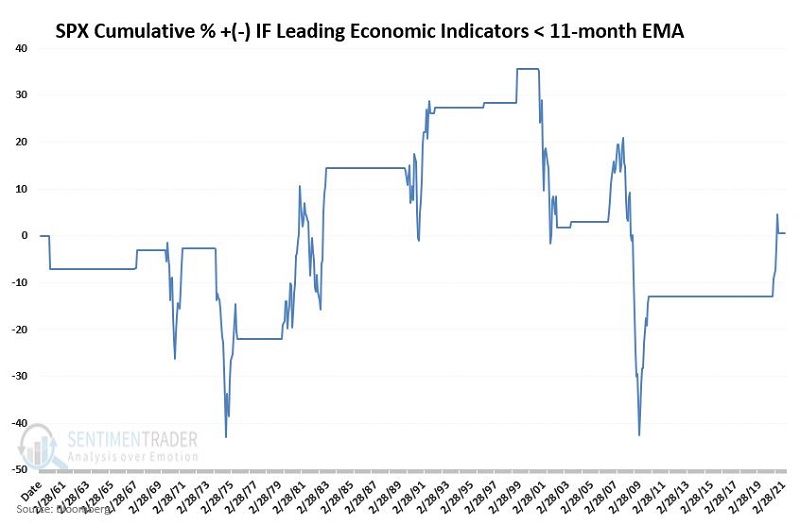
Notice a difference between this chart and the one prior? As you can see, the overall results displayed in the chart above have been much worse than in the previous chart - with a great deal of volatility, several severe bear market declines, and essentially no overall gain.
SUMMARY
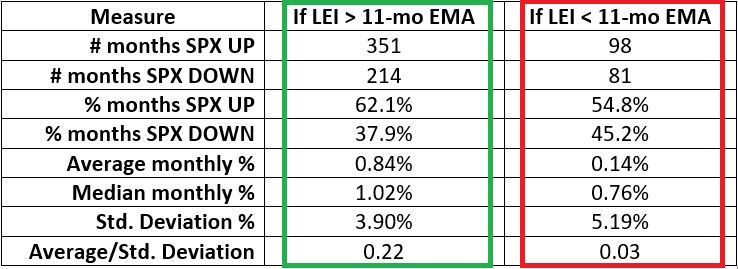
The results displayed in the chart below confirm that overall the stock market clearly tends to perform better when the Leading Economic Indicators are objectively trending higher.
LEI TREND CALCULATIONS
A = 11
B = 2 / (11 + 1) [i.e., B = 0.1667]
C = (1 - B) [i.e., C = 0.8333]
D = Last month's moving average
E = Current month's Leading Economic Indicators index reading
F = D * C
G = E * B
H = F + G
At the end of March 2021 the 11-month EMA was 108.62
At the end of April 2021, the reported value for LEI was 111.60
To determine the trend, we fill in the variables above:
A = 11
B = 2 / (11 + 1) [i.e., B = 0.1667]
C = (1 - B) [i.e., C = 0.8333]
So:
D = 108.62 [latest previous EMA]
E = 111.60 [latest LEI reading]
F = (108.62 * 0.8337) or 90.52 (i.e., D * C)
G = (111.60 * 0.1667) or 18.60 (i.e., E * B)
H = (90.52 + 18.60) or H = 109.12 (i.e., F + G)
For identifying the current trend of the LEI, we will compare the data series itself (Variable E) to its exponential moving average (Variable H). So, at the end of April 2021:
- E (the latest monthly reading) > H (the 11-month EMA); therefore, this particular indicator is designated as being in an uptrend and thus bullish for stocks during May 2021.
This, of course, in no way guarantees that stocks will rise during May 2021. However, the results in the table above suggest that the odds are much more in favor of stocks than if the LEI trend was down.