Products
SentimenTrader Trading Tools
‍
Backtest Engine
My Trading Toolkit
Correlation Analysis
Seasonality
Market Prediction
Indicators & Data API
‍
Proprietary Indicators & Charts
Market Data API
Strategies & Scanner
‍
50+ Trading Strategies
Smart Stock Scanner
Smart Option Scanner
Research Reports
‍
Research Solutions
Reports Library
Free Resources
Simple Backtest Calculator
Simple Seasonality Calculator
The Kelly Criterion Calculator
Sentiment Geo Map
Public Research Reports
Education
Sentiment Indicators
Technical Indicators
Pricing
Company
About
In the News
Testimonials
Client Success Stories
Contact
Log inLoginSign up
< BACK TO ALL REPORTS

Late-session strength points to further gains

by Sentimentrader
2025-09-15
A sharp spike in the last-hour indicator—a measure of late-day buying interest or overall risk appetite—often signals conviction among buyers. Historically, such spikes have been highly predictive of sustained uptrends, with roughly 90% of cases leading to a higher S&P 500 over the following six months.

Key points:

  • The last hour indicator rose for nine straight sessions
  • Similar win streaks saw the S&P 500 rally 90% of the time over the next six months
  • Technology displayed the most favorable outperformance trends

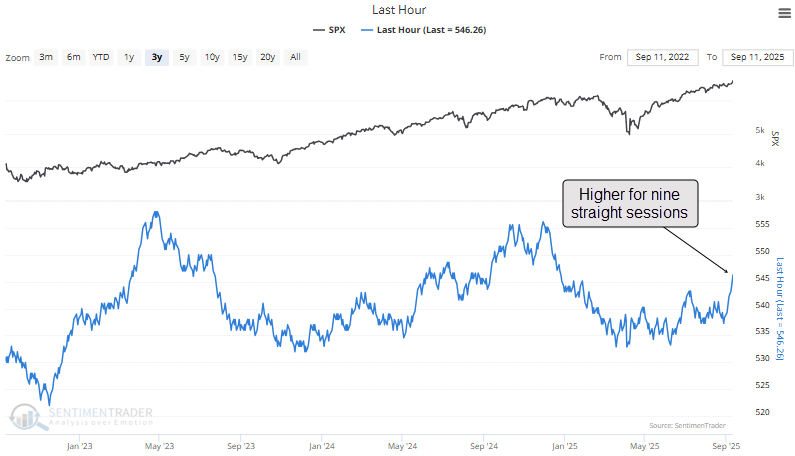
Sustained buying pressure in the last hour of trading 

The final hour of trading has shown consistent buying interest, with this critical period of the day displaying a gain for nine consecutive sessions -a streak not seen since April 2023, when equities were recovering from the 2022 bear market.

A measure of risk appetite, the last-hour indicator tends to spike like now when traders are concerned about bearing the risk of overnight upward drift in stocks.

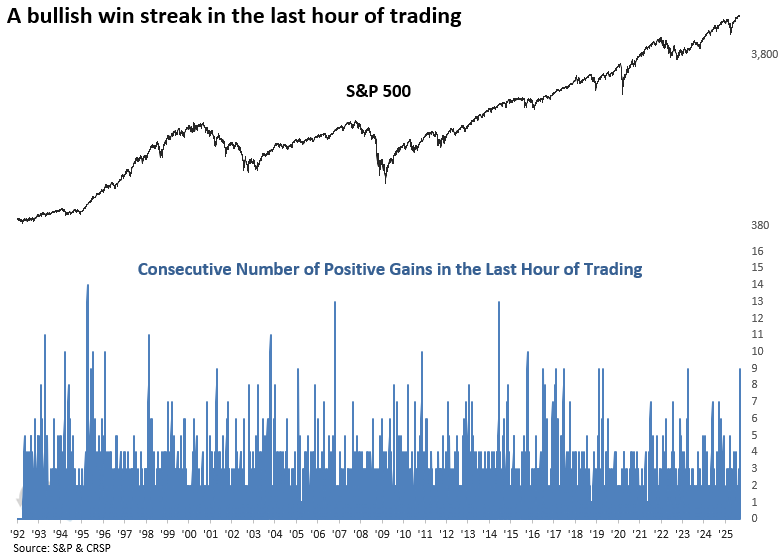
Since 1992, win streaks lasting nine sessions or longer have occurred in fewer than 1% of trading sessions, underscoring rare and persistent late day buying pressure.

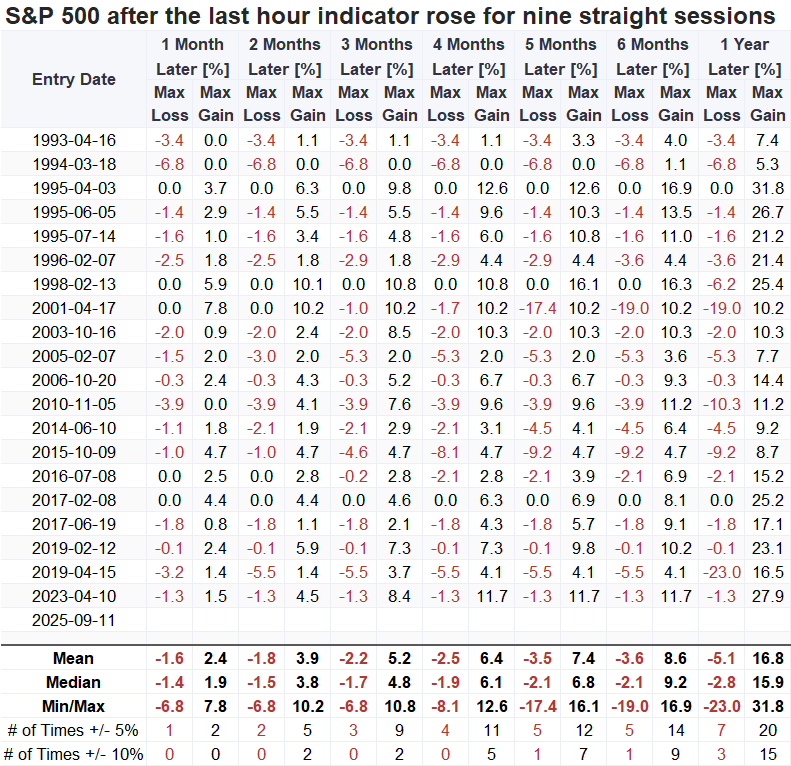
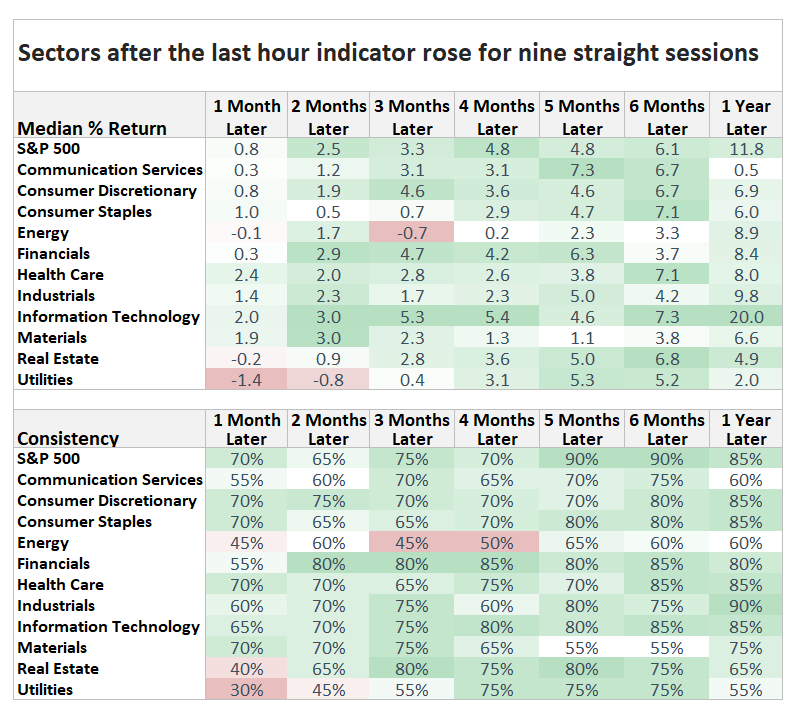
Buying pressure points to a sustainable uptrend

Whenever the last hour indicator rose for nine straight sessions, the S&P 500 displayed solid returns and consistency, suggesting the uptrend in stocks is likely to persist.  

Similar to now, three prior instances occurred with the S&P 500 closing at a high-in June 1995, February 1996, and June 2017-and in each case, the index was higher six months later.

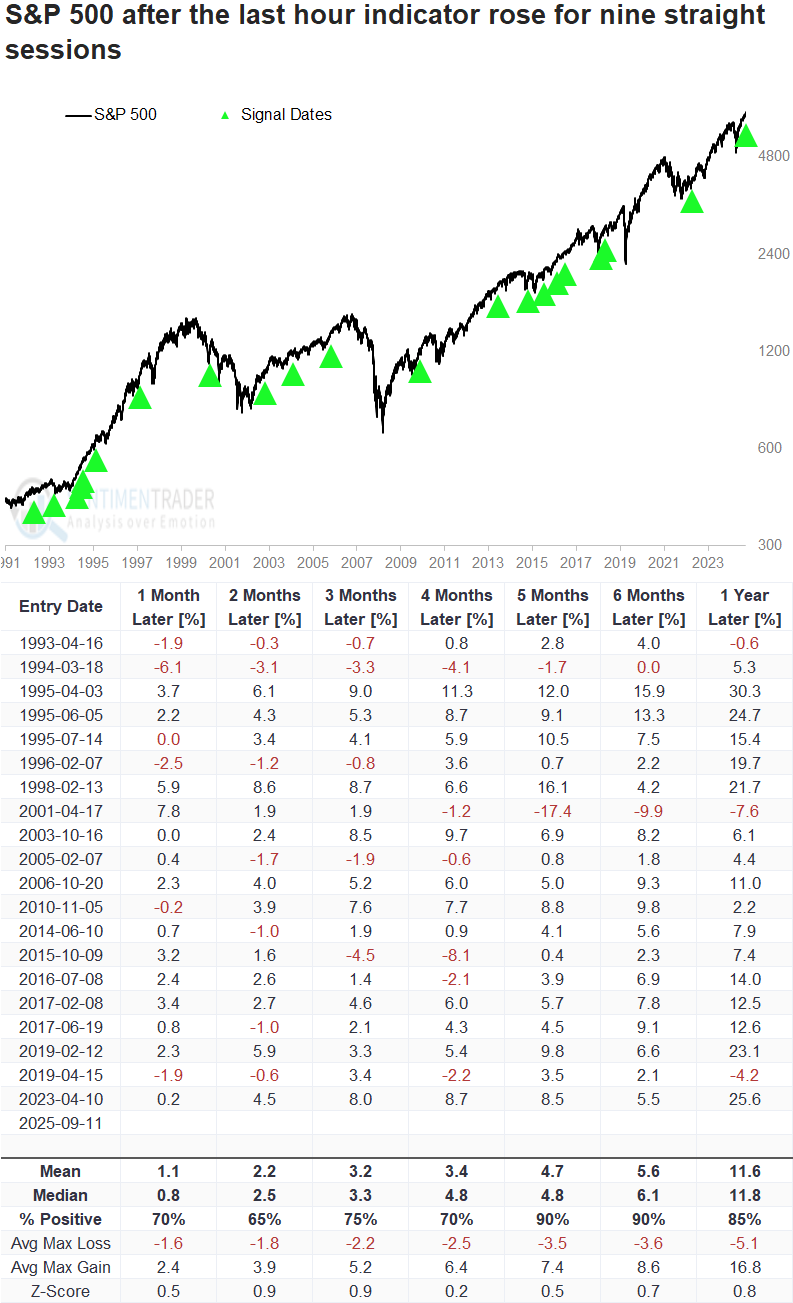
Over the next year, the S&P 500 experienced a decline of more than 10% on three occasions. In contrast, it rose by more than 10% in 15 instances, indicating a favorable risk/reward profile.

The technology sector outperformed the broad market in 6 out of 7 horizons, suggesting investors should stick with this group as it continues to exhibit leadership status in the current uptrend.

What the research tells us...

After a brief dip near the end of August, buyers quickly stepped in, driving the S&P 500 to fresh record highs. The buying pressure was especially strong in the final hour of trading, helping fuel a rare nine-session winning streak during this critical period. Historically, comparable streaks have been followed by a bullish outcome, with the S&P 500 rising nearly 90% of the time over the next six months. Technology consistently emerged as the clear leader after such events, a pattern that aligns closely with today's relative strength trends. 

PRODUCTS
SentimenTrader
Trading Tools
Indicators & Data API
‍
Strategies & Scanner
‍
Research Reports
FREE
RESOUrCES
Simple Backtest
Calculator
Simple Seasonality
Calculator
The Kelly Criterion
Calculator
Sentiment Geo Map
‍
Public Research Reports
‍
Education
Sentiment Indicators
‍
Technical Indicators
‍
Pricing
Bundle pricing
‍
FAQ
‍
Announcements
‍
COMPANY
‍
About
‍
In the News
‍
Testimonials
‍
Client Success Stories
CONTACT
‍
General Inquiries
‍
Media Inquiries
‍
Financial Professionals Inquiries
‍
© 2026 Sundial Capital Research Inc. All rights reserved.
Setsail Marketing
TermsPrivacyAffiliate Program
Risk Disclosure: The information and tools provided are for research and analytical purposes only and are not intended as investment advice. Market analysis involves uncertainty, and outcomes may differ from expectations. Users should conduct their own due diligence and consider their individual circumstances before making any financial decisions. Past performance is not necessarily indicative of future results.

Hypothetical Performance Disclosure: Hypothetical performance results have many inherent limitations, some of which are described below. No representation is being made that any account will or is likely to achieve profits or losses similar to those shown; in fact, there are frequently sharp differences between hypothetical performance results and the actual results subsequently achieved by any particular trading program. One of the limitations of hypothetical performance results is that they are generally prepared with the benefit of hindsight. In addition, hypothetical trading does not involve financial risk, and no hypothetical trading record can completely account for the impact of financial risk of actual trading. for example, the ability to withstand losses or to adhere to a particular trading program in spite of trading losses are material points which can also adversely affect actual trading results. There are numerous other factors related to the markets in general or to the implementation of any specific trading program which cannot be fully accounted for in the preparation of hypothetical performance results and all which can adversely affect trading results.

Testimonial Disclosure: Testimonials appearing on this website may not be representative of other clients or customers and is not a guarantee of future performance or success.