
Last gasp 4th quarter power period for SPX

Key points
- There is no way to know when the latest downtrend will end or how far down it may run
- Nevertheless, the stock market has demonstrated a long-term tendency to perform well during the 4th quarter of the year
- Our Annual Seasonal Trend chart suggests strength between Trading Day of the Year #208 and the end of the year
S&P trend is typically - though notably, not always - favorable after TDY #208
It is not a secret that the 4th quarter tends to be good for stock market investors, particularly beginning in late October. But just how useful is this tendency when it comes to real-world trading? Let's examine one specific period and measure the results. The chart below displays the Annual Seasonal Trend for the S&P 500 Index. 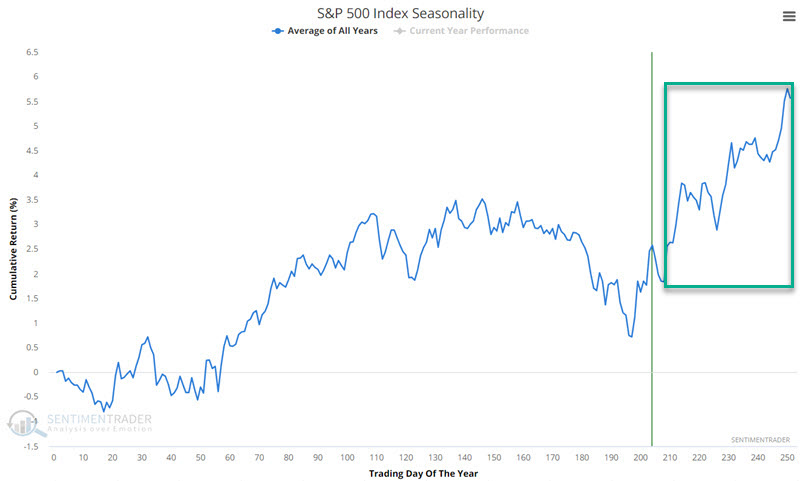
As you can see in the chart above, the market shows seasonal strength from Trading Day of Year #208 through the end of the year. So that will be our test:
- Buy at the close of TDY #208
- Sell at the close of the last trading day of the year
We will start our test in 1953 (because before 1953, the NYSE was open for a few hours on Saturday, so there were technically more trading days in a year before 1953). For 2023, this period begins at the close of trading on 2023-10-30 and extends through the close on 2023-12-29.
The results are informative
The chart below displays the year-by-year results in column form.
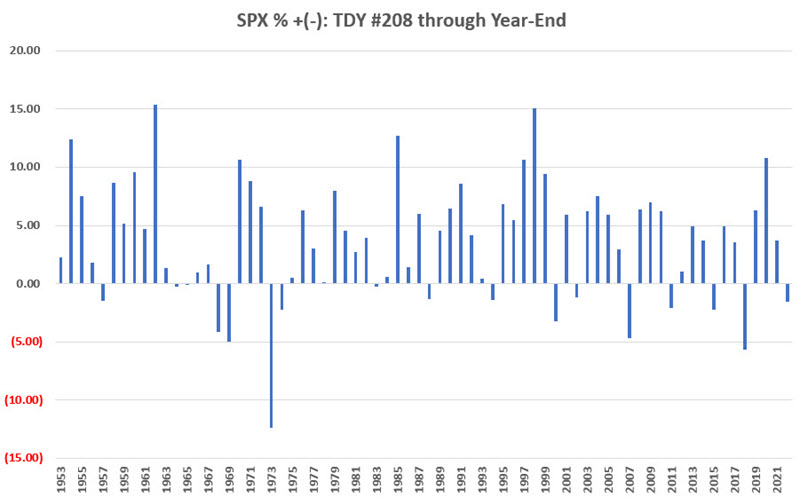
Eyeballing the chart above suggests a bullish tilt, with many more "up" periods than "down," BUT not without a few significant "downs" along the way.
The chart below displays the day-to-day equity curve and the hypothetical growth of $1 held in the S&P 500 Index (price-performance only) ONLY during this "favorable" period.
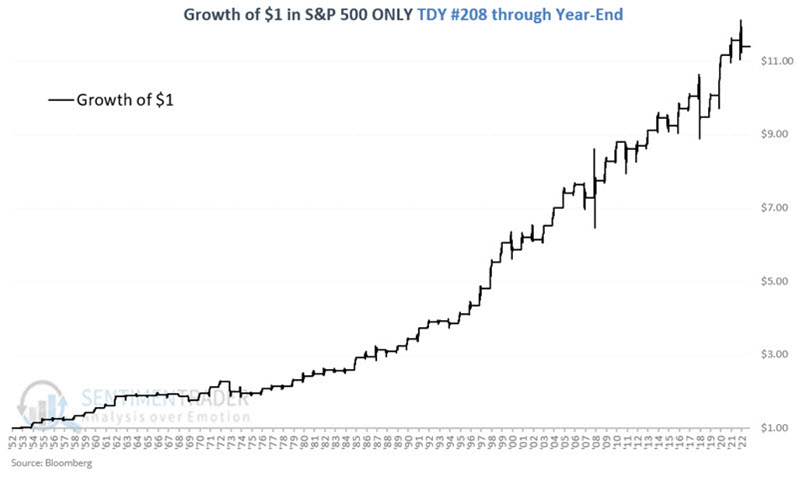
Two things to note:
- The upward slope of the results is unmistakable
- However, there is no guarantee from year to year that results will be favorable
The table below summarizes S&P 500 performance between TDY #208 and the end of the year
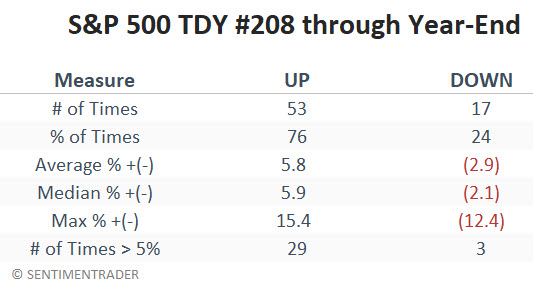
The bottom line would appear to be that investors:
- Should give the bullish case the benefit of the doubt during the late 4th quarter
- But one can NEVER throw caution to the wind
Considering drawdowns
The "How much?" and "How often?" questions are relevant to any approach to trading under consideration. However, in real-world trading, the other question that must be addressed simultaneously is "How bad?" as in, "How bad does it get along the way?" i.e., how much of a decline must an investor be prepared to sit through to enjoy the perceived rewards?
So, let's consider the magnitude of decline a trader would have to sit through if they bought at the close on TDY #208 and sold at the close of the last trading day of the year. Measured from the closing price on TDY #208 in the previous 70 years:
- 29 years (or 41.4% of all years) saw a drawdown of LESS THAN -1% between the close on TDY #208 and the end of the year
- 60 years (or 85.7% of all years) saw a drawdown of LESS THAN -5% between the close on TDY #208 and the end of the year
- 67 years (or 95.7% of all years) saw a drawdown of LESS THAN -10% between the close on TDY #208 and the end of the year
Only 3 of the last 70 years saw a drawdown greater than -10% after TDY #208 (1973 = -17.26%, 2008 = -11.37%, 2018 = -11.57%). It should be noted that all three of those years experienced weakness throughout the year leading up to TDY #208 - which arguably may have presaged a weaker-than-normal fourth quarter. Despite the considerable weakness in the last three months, 2023 as a whole does not fit this pattern.
What the research tells us...
As always, seasonality is not a roadmap, only an average of previous performance. The fact that the stock market has tended to skew positive after TDY #208 in the past does not guarantee a positive return this year. That said, given the current bearish narrative that seems to dominate the financial news, seasonal trends remind us that "anything can happen" and that we should at least keep an open mind to the possibility of an upside surprise before the end of the year.