
Large traders continue to pay record amounts for protection

Key points:
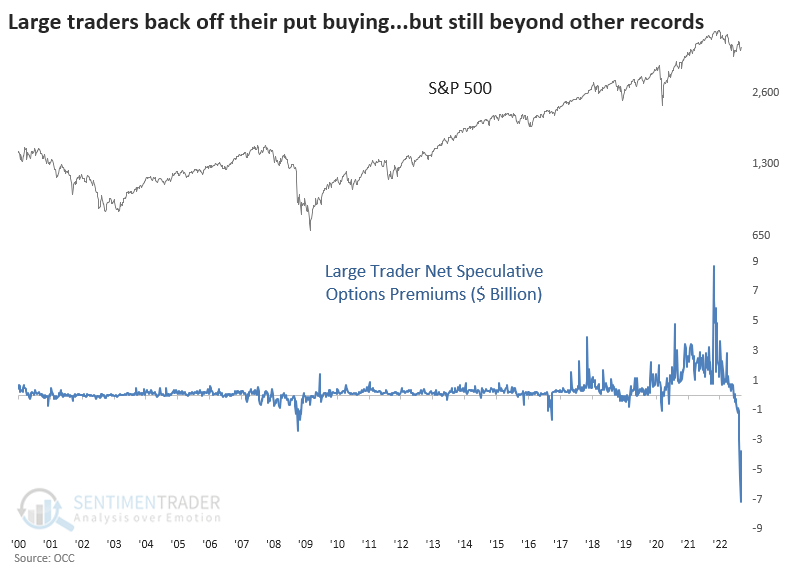
- Last week, large traders backed off a bit from put buying but are still pressing heavily
- Relative to other metrics, their put volume is high but not at record levels
- In terms of money spent, though, their put buying is at record highs
Institutional traders are still buying large amounts of hedges
A week ago, we looked at the behavior of institutional options traders. In record fashion, they were betting against stocks. They've backed off a bit but continue to hedge heavily. Maybe it will pay off if markets truly dislike the latest inflation readings.
Last week, they spent $4.6 billion buying new put options to open. They spent less than $850 million on calls. So, they spent $3.7 billion more on protective put options than speculative call options. That spread is still beyond any other week in 22 years, except the prior week when the spread was more than $7 billion.
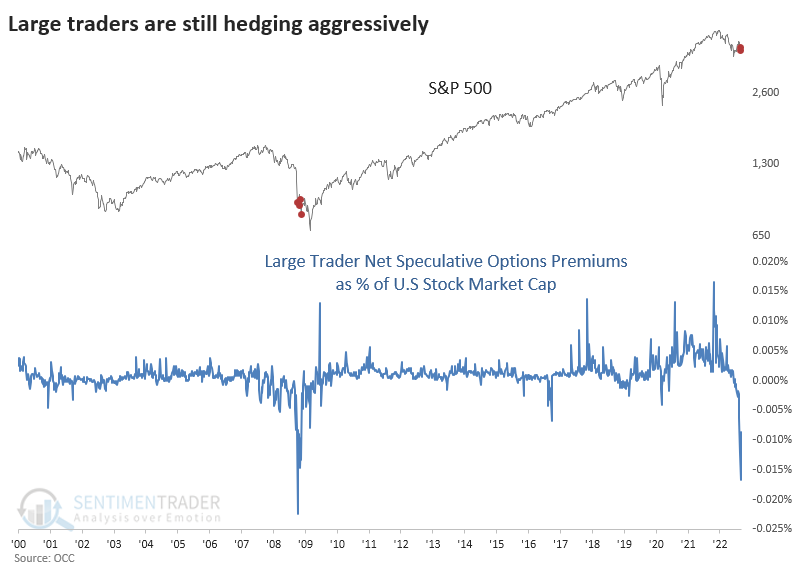
To answer some of the questions about that data, the following charts normalize it in several ways to see just how extreme this behavior really is.
As a percentage of the market capitalization of the U.S. stock market, the premiums spent are tiny. But that ignores the knock-on effects of heavy options volume, like dealer hedging and gamma effects. Even so, the last two weeks have seen the relative hedging value on par with October - November 2008.
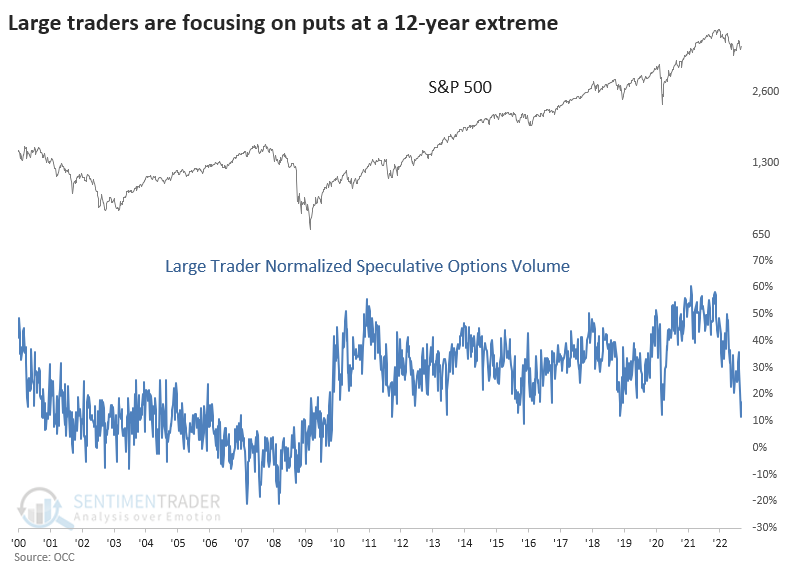
Another criticism was that we only looked at premiums, not volume. That criticism is questionable, but okay, let's look at that. The chart below normalizes the volume. The formula used in the chart is:
(Call buys to open - Put buys to open) / (Call buys to open + Put buys to open)
It has dropped to about the lowest levels since the global financial crisis. In the decade prior, it was consistently lower than where it has been over the past decade. I don't know why.
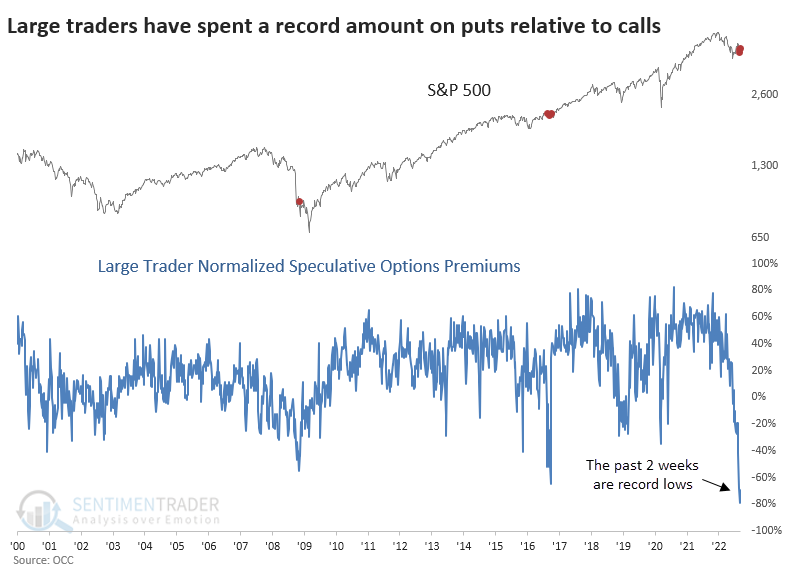
We've been more focused on the actual dollar value of these trades. While volume is helpful, looking at the actual, real dollars being exchanged is usually just as or more informative. When we use that same formula to normalize the data but look at the premiums, it's a different picture.
Last week and the week before witnessed these traders' most extreme put buying ever.
"Okay, okay," another criticism goes. "They're buying a lot of puts, but they're probably selling a lot of puts, too, so it doesn't mean anything."
We already looked at that last week, but here's another shot. The chart below shows how many puts these traders bought relative to how many puts they sold and how many calls they bought and sold (total volume). We're looking at opening transactions only, no closing transactions.
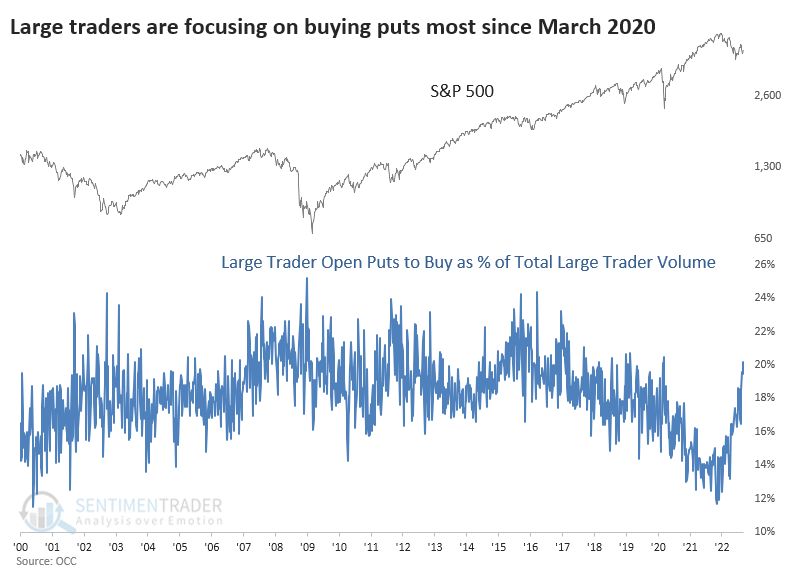
Critics have a little bit of a point here. Relative to all volume, large institutional traders are spending about 20% of their volume buying puts to open. That's up from less than 12% last November, but it's less than previous extremes of 24% or more.
Again, though, we're more focused on the premiums spent - the actual, hard dollars exchanged for the privilege of obtaining these contracts. Things change when we look at the same data but use premiums instead of the volume of contracts.
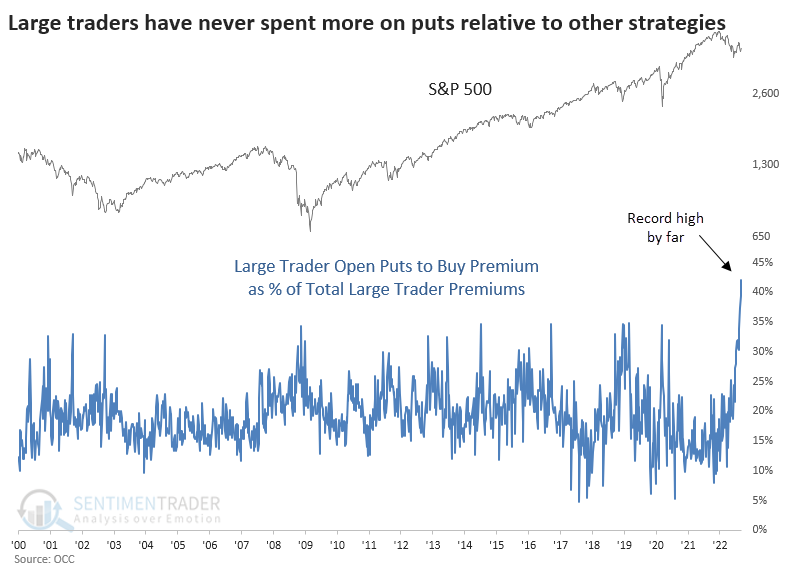
Last week, large traders spent $4.6 billion on opening put buys. They spent $10.5 billion on all opening strategies (call buying, call selling, put buying, and put selling). That means that 42% of the money changing hands was for buying puts to open.
That's a record high. It's even higher than the week before, which was 39%.
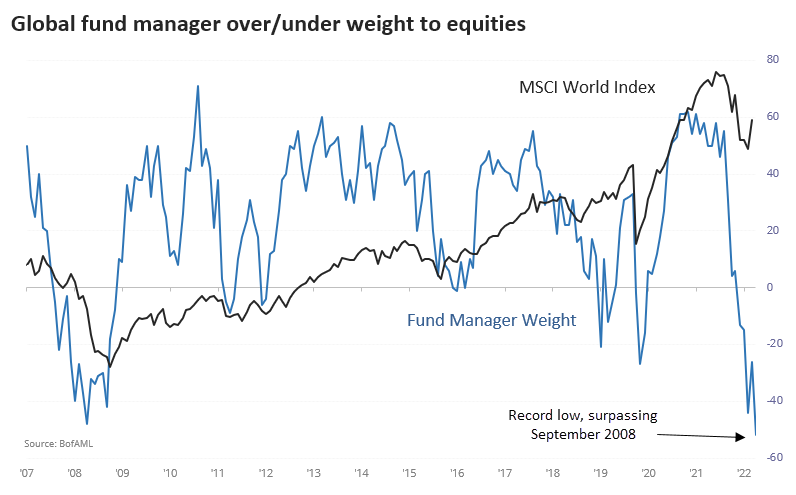
Given the sentiment apparent from institutions, this options data is not surprising. The latest survey of large money managers from Bank of America shows the most pessimism ever.
What the research tells us...
We've heard from all kinds of traders excusing this data. Some said it's worthless because it's just a sizeable reverse conversion strategy on a single stock. Others said it's worthless because there are few precedents, so we can't read anything into it. Still others said it's worthless because it's clearly a data error (it's not).
Maybe there is merit in these criticisms, but we don't make excuses for indicators. That plants us firmly on a slippery slope of assuming we're smarter than the data (we're not). All we know is that the market's largest traders have spent a record amount of money on options hedges on equities over the past two weeks. That didn't prevent short-term weakness in the past, but it also preceded significant gains longer-term.