
Lagging small-cap and discretionary stocks provide a weak warning

Key points:
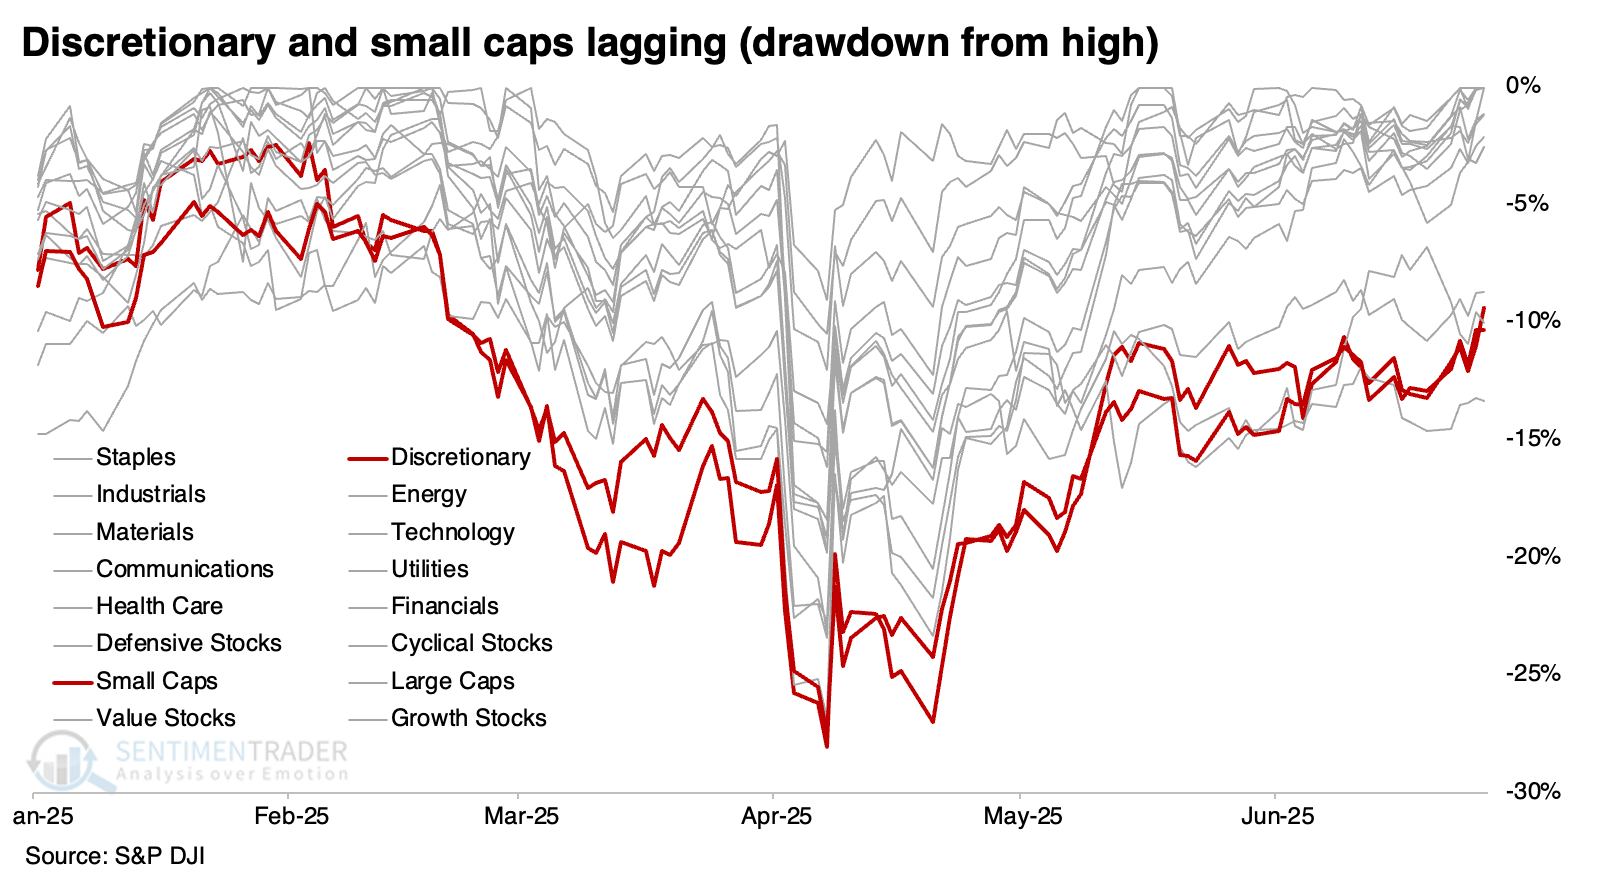
- As the S&P 500 recovered from its correction, small-cap and discretionary stocks lagged
- Both sectors were off more than -5% from their highs as the S&P reached record territory
- While theoretically concerning, similar warning signs during S&P recoveries were not useful (with one exception)
A disturbing lag in sensitive sectors
There's always something to complain about.
Recently, we saw that cyclical sectors helped lead the most recent breakout to record highs. But, according to The Wall Street Journal, the rally isn't being led by what it should be (emphasis added):
Shares of economically resilient companies such as utilities-which investors often buy when they are nervous about growth-have also outpaced the benchmark S&P 500's 5.5% year-to-date gain. Meanwhile, stocks that tend to rise when the economy is booming, such as the consumer-discretionary sector and small-caps, are lagging behind. "That's just not traditional bull-market leadership," said David Lundgren, chief market strategist and portfolio manager at Little Harbor Advisors. "This is not the time to pile into equities, because you're kind of in a very broken, fragile, frayed environment."
Well, now, that begs to be tested. We need to see if it's a valid reason to consider ratcheting down exposure.
The statement itself is undoubtedly true, with only health care in a worse drawdown than discretionary and small-cap stocks. Note that this was as of the S&P 500's initial breakout to new highs near the end of June, but it still holds true today.
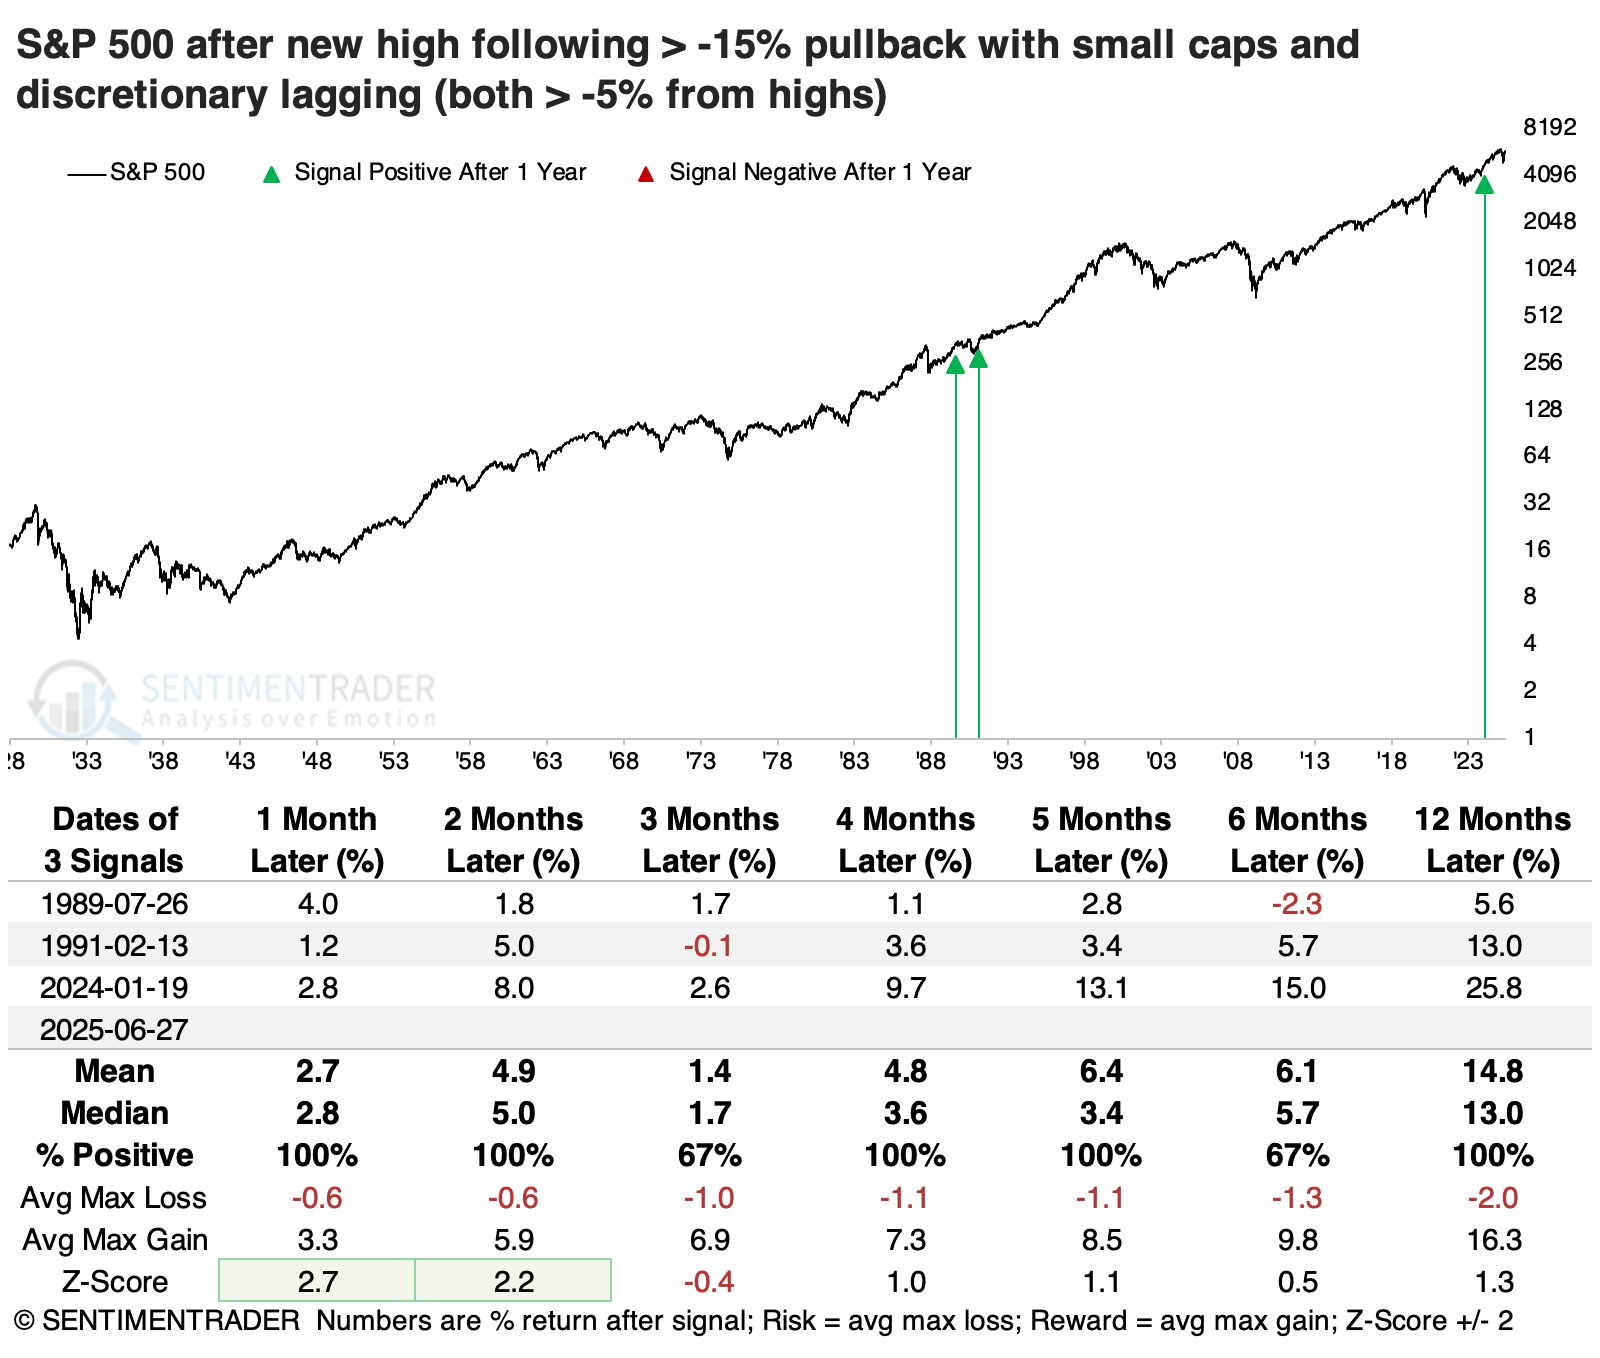
The S&P 500 reached a record high after recovering from at least a -15% drawdown, and when the S&P recovered, both discretionary and small-cap stocks were off more than -5% from their own highs.
This is a very unusual setup, with few precedents even going all the way back to 1926. It has only happened three times, making it impossible to form any firm conclusion. But for whatever it's worth, none of the three instances preceded a significant decline over any time frame.
Only one successful warning shot
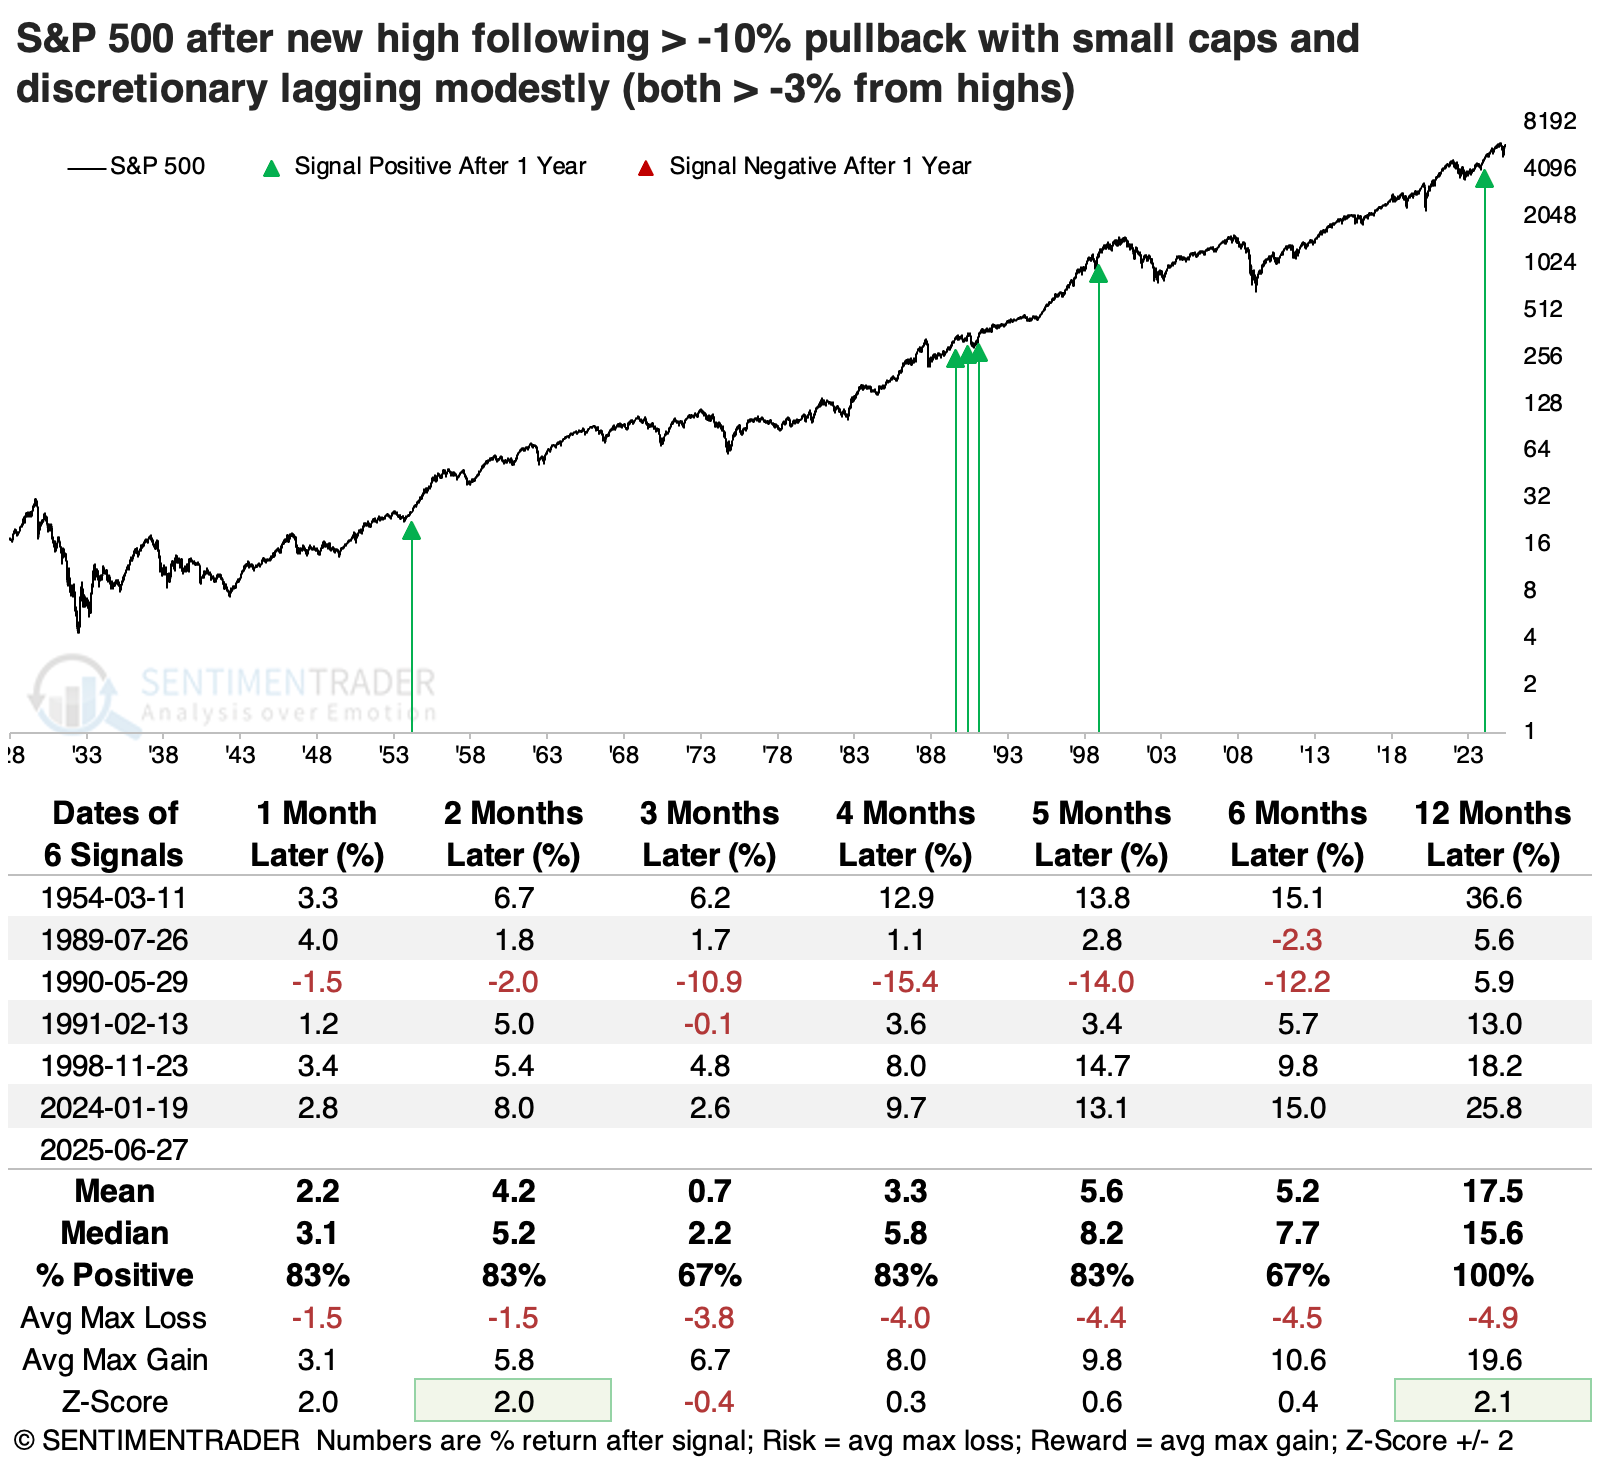
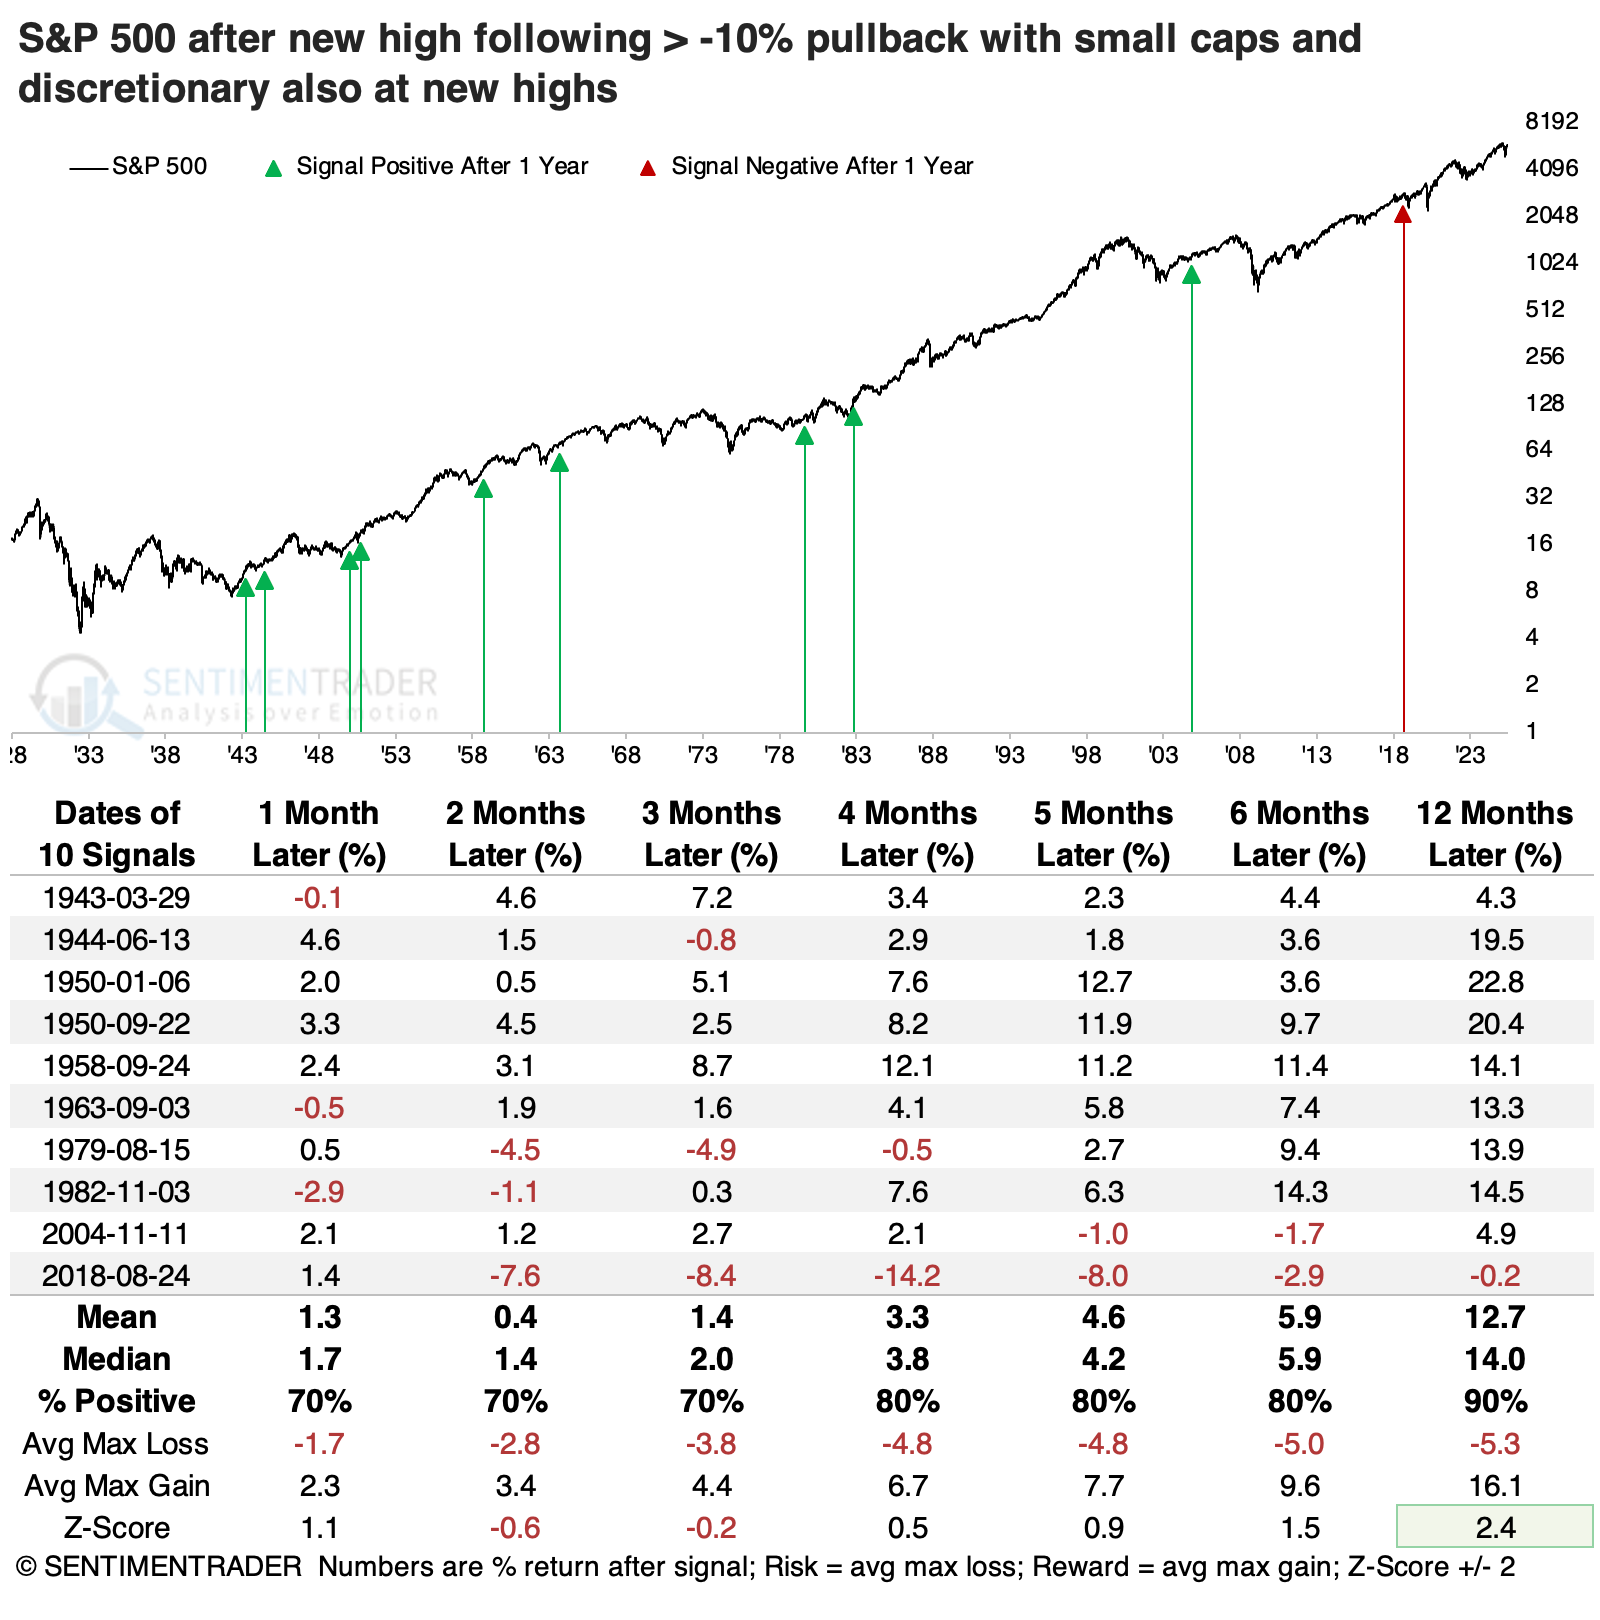
We have to relax the parameters to generate a larger sample size, so the table below shows what happened after any time the S&P 500 recovered from more than a -10% drawdown (instead of -15%). At the time of its recovery, both small caps and discretionary stocks were at least -3% off their own highs (instead of -5%).
This triggered right before the 1990 recession and coincident correction in the S&P, with a fairly vicious drop over the next four months. But that was it for that decline and was also the only instance that preceded any notable drop in stocks. The S&P sported a healthy average return across time frames, with a decent risk/reward ratio over the following year.
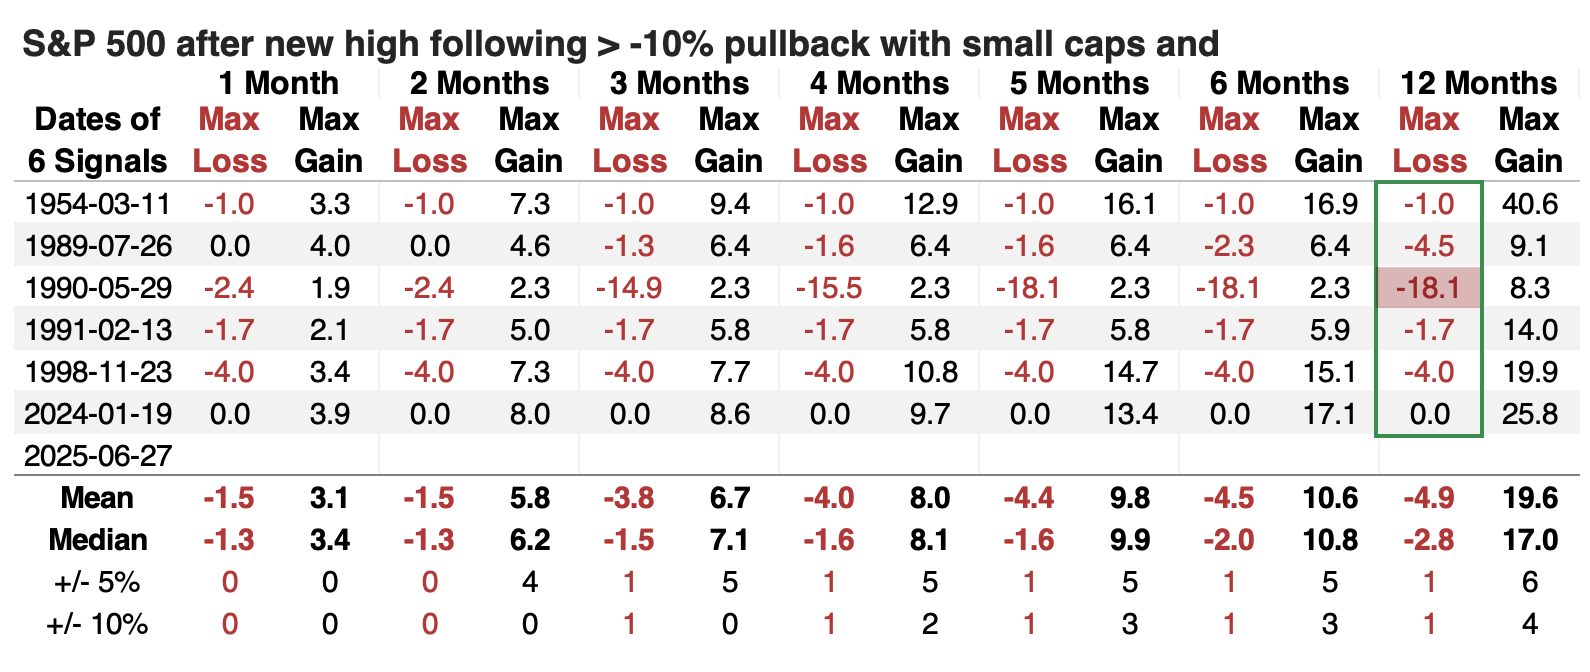
The table of maximum gains and losses across time frames shows how favorable the risk/reward ratio was. The 1990 exception was painful, no doubt. But across the other signals, the maximum drawdown up to a year later was only -4.5%. All the other signals lost no more than that at any point.
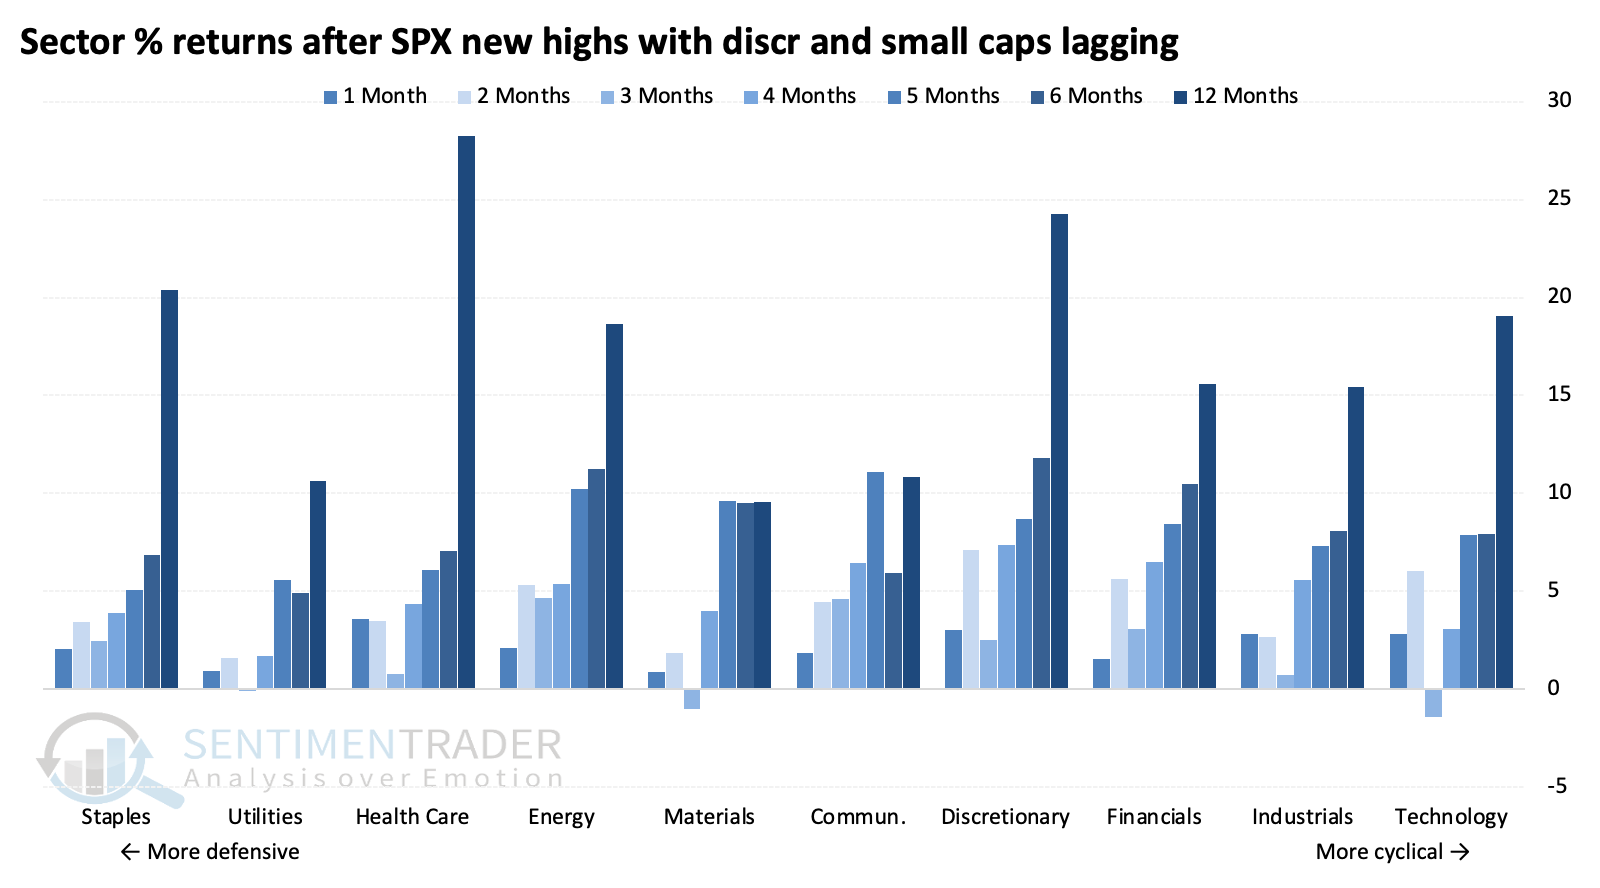
Among factors, cyclical and growth stocks tended to show the best returns. A year later, the growth factor averaged a return north of +30%, far outpacing the other factors.
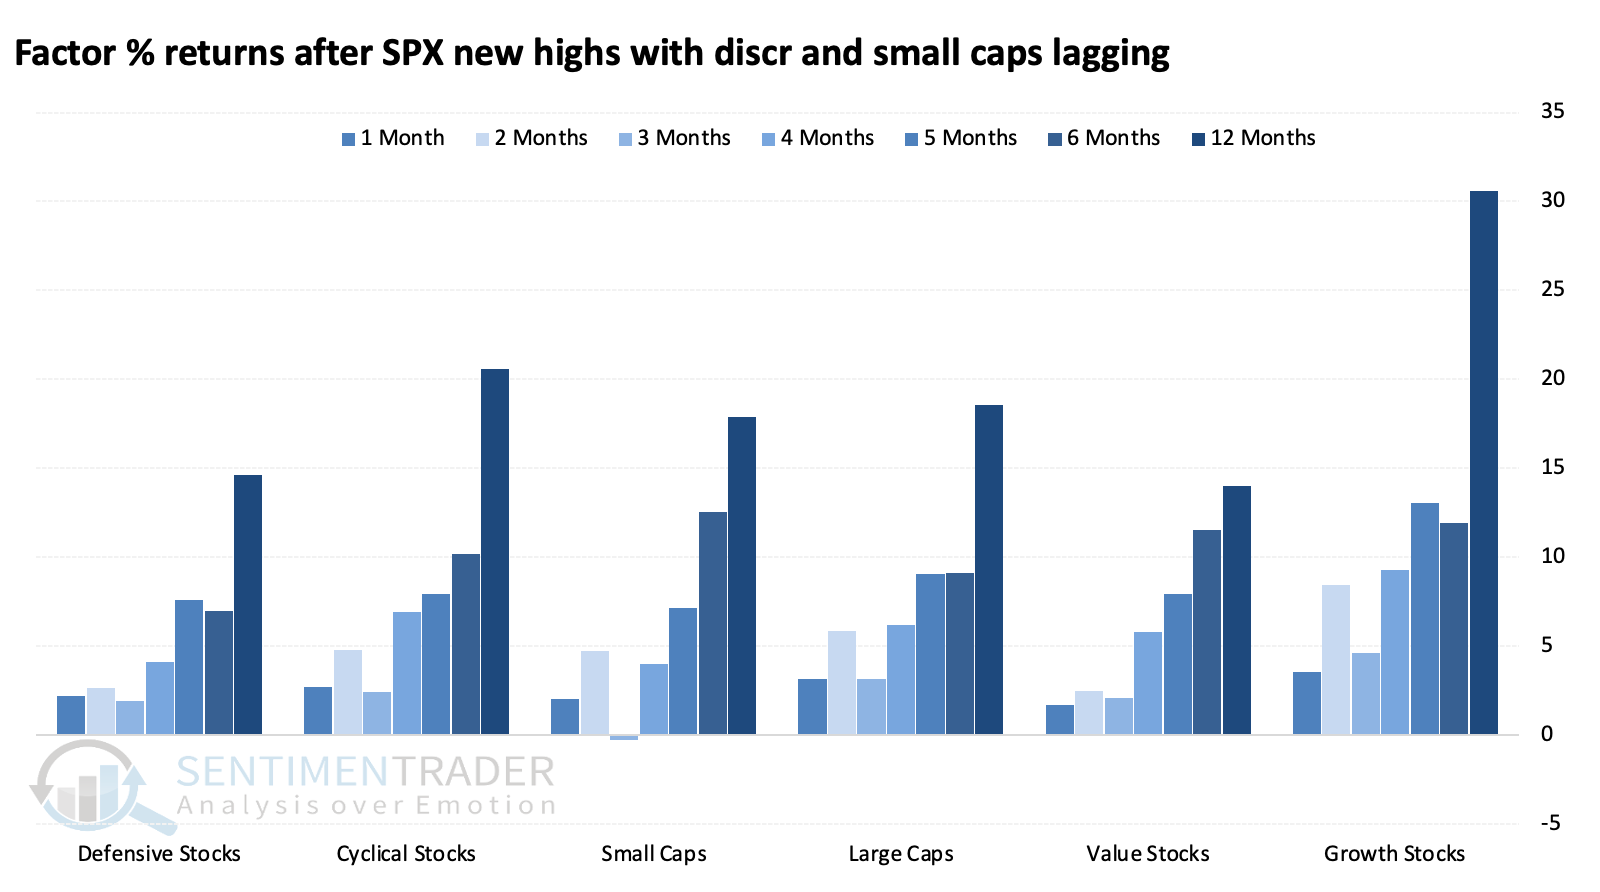
Discretionary stocks showed among the best returns over the following four to twelve months, suggesting some tendency for mean reversion relative to the other sectors that had performed better leading up to the new highs in the S&P.
When there are small sample sizes, we like to look at counterexamples, which often helps generate more confidence in the conditions we're studying. Here, the counter example doesn't help as much - breakouts in the S&P after a modest pullback, when small caps and discretionary stocks also broke out, preceded good returns, too.
The last signal was a fake-out, with stocks entering a protracted rocky period. But that was the only one, with the S&P earning positive returns over the following year every other time.
What the research tells us…
When stocks rally hard and hit new highs, there are always reasons for concern. Watching stock and sector participation has become a popular activity, and for mostly good reason. It has been a beneficial exercise in the past.
Breadth on the latest breakout has been okay - not great, and not terrible. It pays to investigate when claims are made that a breakout may not last for whatever reason, especially if that makes theoretical sense, like the disturbing message that lagging small-cap and discretionary stocks might send. However, that has not historically been a consistent reason for concern, with only one precedent being a successful warning sign. Based on that history, there is no reason to reduce exposure due to those lagging factors alone.