Products
SentimenTrader Trading Tools
‍
Backtest Engine
My Trading Toolkit
Correlation Analysis
Seasonality
Market Prediction
Indicators & Data API
‍
Proprietary Indicators & Charts
Market Data API
Strategies & Scanner
‍
50+ Trading Strategies
Smart Stock Scanner
Smart Option Scanner
Research Reports
‍
Research Solutions
Reports Library
Free Resources
Simple Backtest Calculator
Simple Seasonality Calculator
The Kelly Criterion Calculator
Sentiment Geo Map
Public Research Reports
Education
Sentiment Indicators
Technical Indicators
Pricing
Company
About
In the News
Testimonials
Client Success Stories
Contact
Log inLoginSign up
< BACK TO ALL REPORTS

Korea's crash was the test but the repair was the signal

by Sentimentrader
2026-06-25
South Korea's KOSPI suffered a rare nearly 10% single-day plunge this week. Historical analysis shows strong-trend selloffs with fast repairs point to a constructive short-term outlook for Korean equities and US tech stocks.

Key points:

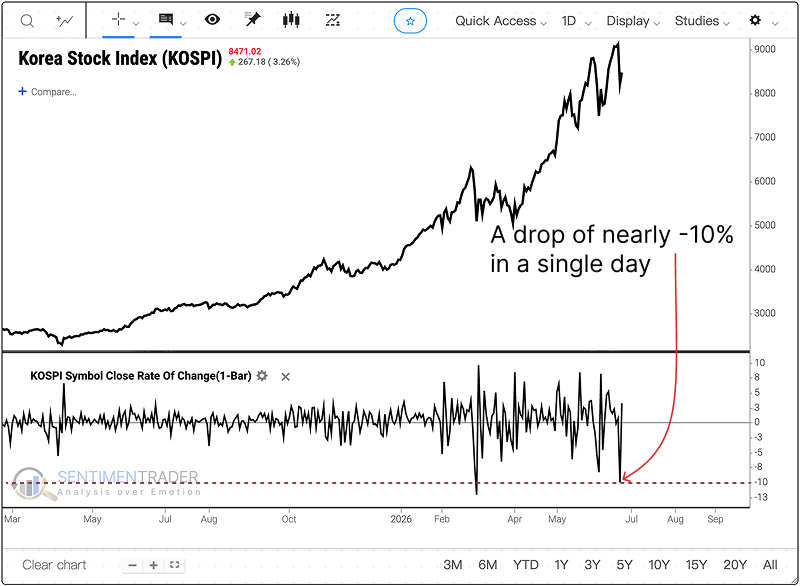
  • KOSPI fell nearly 10% in a single day this week, one of only 15 such declines on record
  • The simple crash signal is not a clean directional indicator. Twelve-month outcomes ranged from a 26.4% loss to a 176.7% gain.
  • Strong-trend selloffs and fast repair produced a more useful read, and the transmission to US tech was positive in the short term

Korea is no longer a local story

KOSPI dropped nearly 10% in a single session this week. A move of that size is extreme in any market, and the index had roughly tripled from its 2025 lows. The question that matters is whether pressure on a market that has been a bellwether for global semiconductor and AI demand travels beyond Korea.

I screened for every instance when KOSPI fell more than 7% in a single day. The search returned 15 signals, spanning more than four decades. That is a small sample, and it ranges from the Asian Financial Crisis through the COVID shock, alongside strong-trend corrections like 1993 and 2024.

Korea's crash was the test but the repair was the signal

A year after a single-day KOSPI crash of more than 7%, the index was higher 62% of the time with a median return of 31.7%. The range is extreme, spanning from severe losses to triple-digit gains. The 1-month and 6-month

Sorry, you don't have access to this report

Upgrade your subscription plan to get access
Go to Dasboard
PRODUCTS
SentimenTrader
Trading Tools
Indicators & Data API
‍
Strategies & Scanner
‍
Research Reports
FREE
RESOUrCES
Simple Backtest
Calculator
Simple Seasonality
Calculator
The Kelly Criterion
Calculator
Sentiment Geo Map
‍
Public Research Reports
‍
Education
Sentiment Indicators
‍
Technical Indicators
‍
Pricing
Bundle pricing
‍
FAQ
‍
Announcements
‍
COMPANY
‍
About
‍
In the News
‍
Testimonials
‍
Client Success Stories
CONTACT
‍
General Inquiries
‍
Media Inquiries
‍
Financial Professionals Inquiries
‍
© 2026 Sundial Capital Research Inc. All rights reserved.
Setsail Marketing
TermsPrivacyAffiliate Program
Risk Disclosure: The information and tools provided are for research and analytical purposes only and are not intended as investment advice. Market analysis involves uncertainty, and outcomes may differ from expectations. Users should conduct their own due diligence and consider their individual circumstances before making any financial decisions. Past performance is not necessarily indicative of future results.

Hypothetical Performance Disclosure: Hypothetical performance results have many inherent limitations, some of which are described below. No representation is being made that any account will or is likely to achieve profits or losses similar to those shown; in fact, there are frequently sharp differences between hypothetical performance results and the actual results subsequently achieved by any particular trading program. One of the limitations of hypothetical performance results is that they are generally prepared with the benefit of hindsight. In addition, hypothetical trading does not involve financial risk, and no hypothetical trading record can completely account for the impact of financial risk of actual trading. for example, the ability to withstand losses or to adhere to a particular trading program in spite of trading losses are material points which can also adversely affect actual trading results. There are numerous other factors related to the markets in general or to the implementation of any specific trading program which cannot be fully accounted for in the preparation of hypothetical performance results and all which can adversely affect trading results.

Testimonial Disclosure: Testimonials appearing on this website may not be representative of other clients or customers and is not a guarantee of future performance or success.