Products
SentimenTrader Trading Tools
‍
Backtest Engine
My Trading Toolkit
Correlation Analysis
Seasonality
Market Prediction
Indicators & Data API
‍
Proprietary Indicators & Charts
Market Data API
Strategies & Scanner
‍
50+ Trading Strategies
Smart Stock Scanner
Smart Option Scanner
Research Reports
‍
Research Solutions
Reports Library
Free Resources
Simple Backtest Calculator
Simple Seasonality Calculator
The Kelly Criterion Calculator
Sentiment Geo Map
Public Research Reports
Education
Sentiment Indicators
Technical Indicators
Pricing
Company
About
In the News
Testimonials
Client Success Stories
Contact
Log inLoginSign up
< BACK TO ALL REPORTS

Knee-Jerk Election Patterns

Jason Goepfert
2016-11-10
null

As investors sort through the large moves made across markets and sectors following the election, the knee-jerk reaction among traders was that there would be clear winners and losers based on a change in administration, and some of the moves were extreme.

Knee-jerk reactions are often misleading and once the dust settles, we see more rational and considered trading take place. Often, that means a complete reversal of the initial move.

Let's go back to 1928 and look at the presidential election day-after reactions across markets and sectors. We'll then look at returns going forward, and see if there is any correlation between the knee-jerk cowboys and longer-term investors.

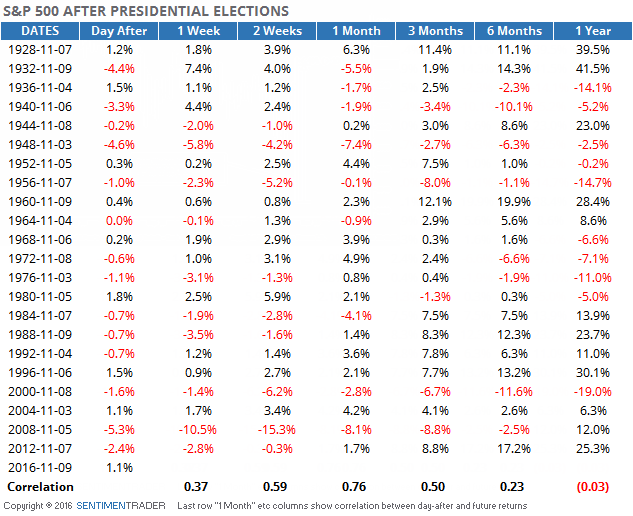
For example, here are the day-after returns in the S&P 500. The "1 Week" etc columns show how the S&P performed in the week(s) following the day after. We can see that in 2012, the S&P lost 2.4% the day after the results came in, and then lost another 2.8% in the week after that.

The last row shows us that there was a correlation of 0.76 between the knee-jerk post-election reaction and the S&P's return 1 month later. Correlations range from -1.00 (perfectly inverse) to +1.00 (perfect correlation), so a correlation of nearly 0.8 is impressive, and a good sign for stocks going forward. That was the peak of the correlation, however, and a year later there was actually a negative correlation between the day-after and one-year returns, but it was small enough that it suggests there was essentially no correlation.

20161110_spx

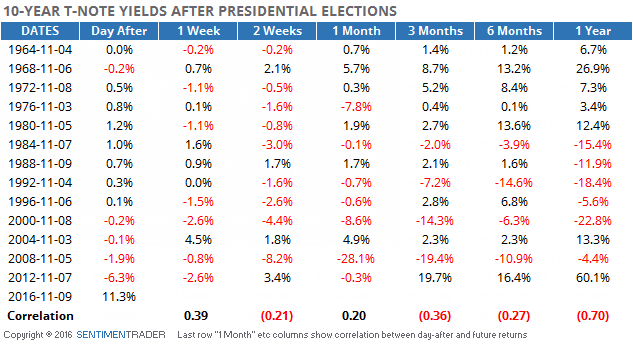
For bonds, there was a mostly negative correlation between how yields performed the day after to how they did going forward, especially longer-term.

20161110_note

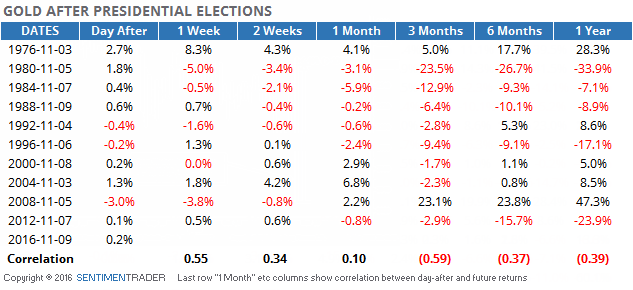
Gold tended to trade in the same direction as the knee-jerk reaction in the short-term, but reversed that in the weeks and months following, trading in an opposite direction more often than not.

20161110_gold

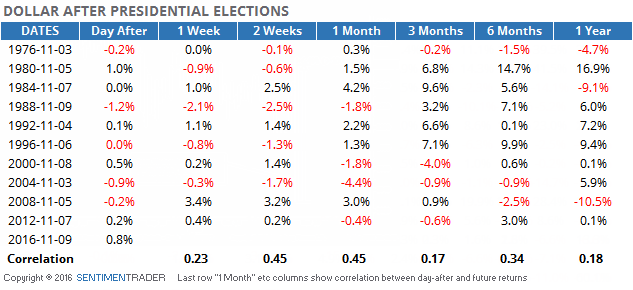
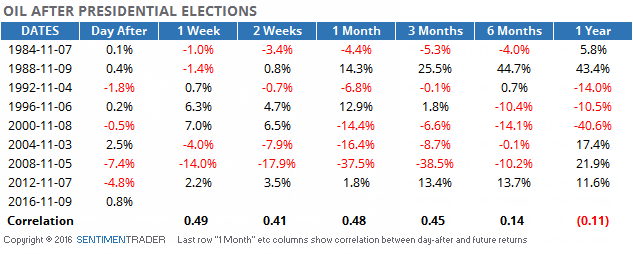
The U.S. dollar and oil, however, tended to have positive correlations between their knee-jerk reactions and future returns, at least over the next month.

20161110_dollar

20161110_oil

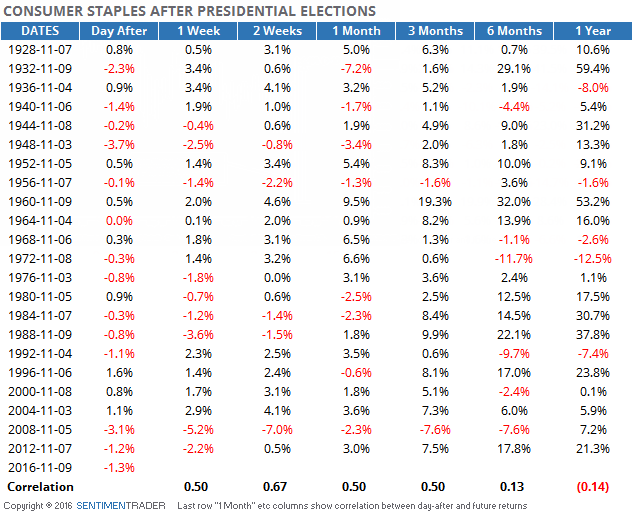
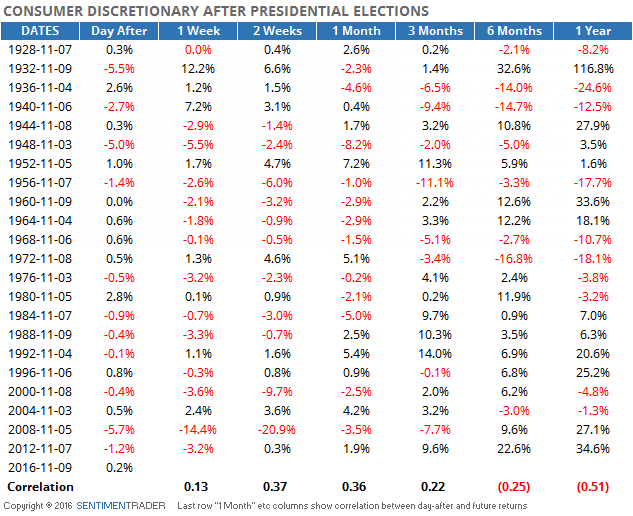
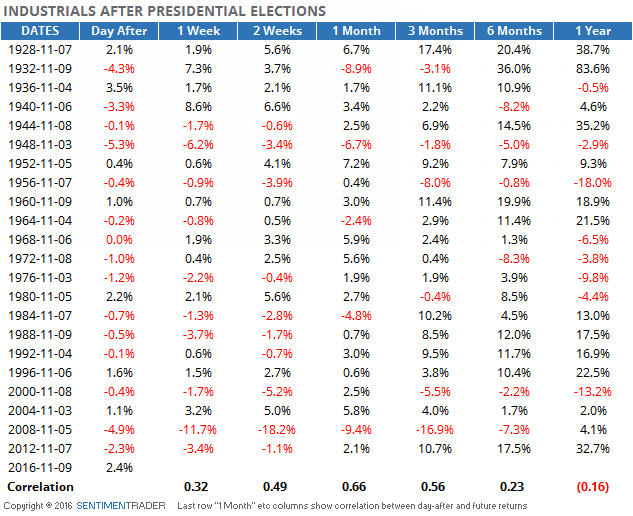
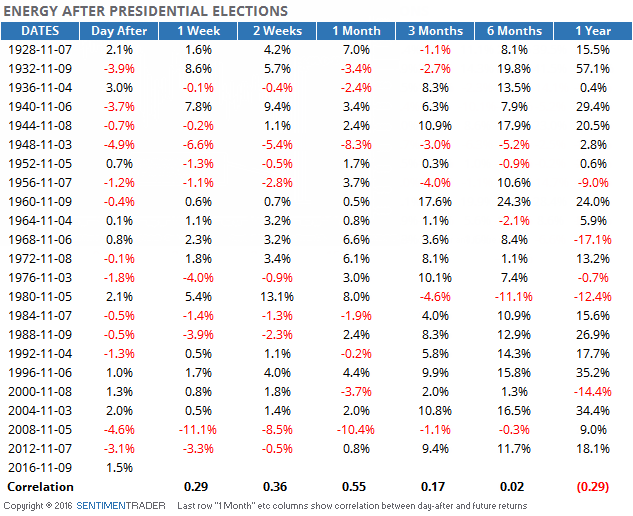
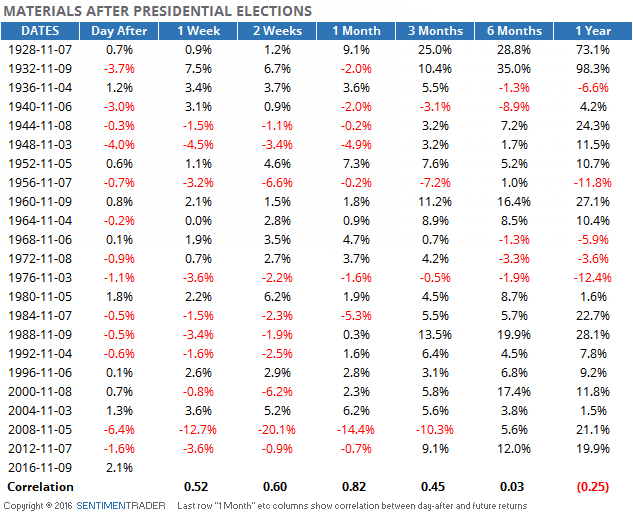
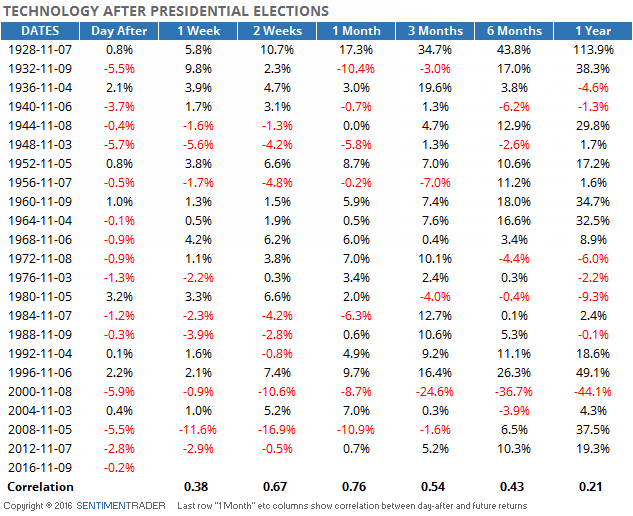
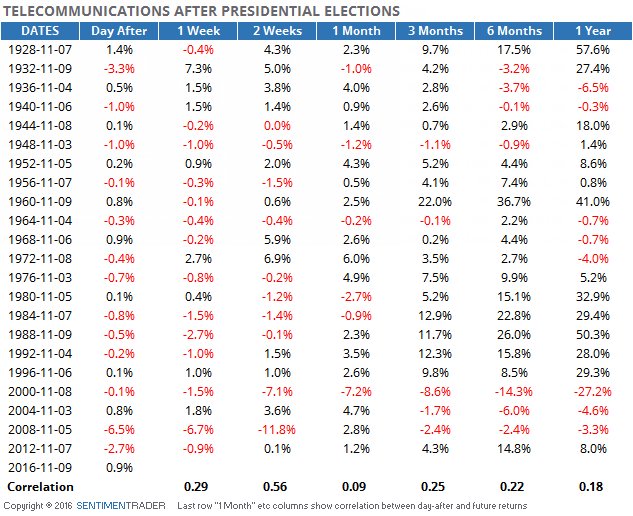
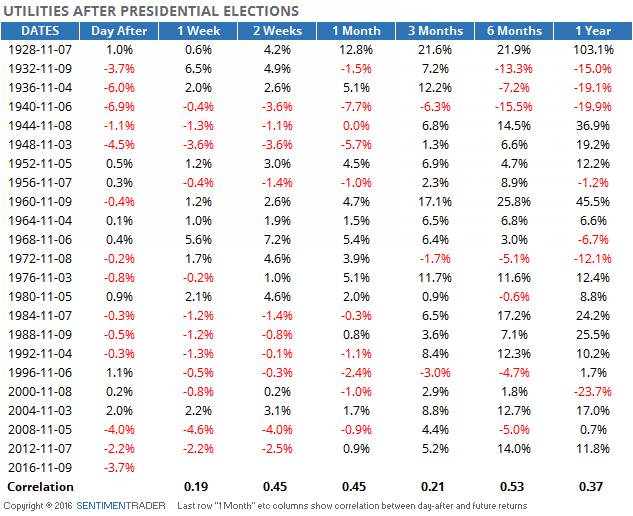
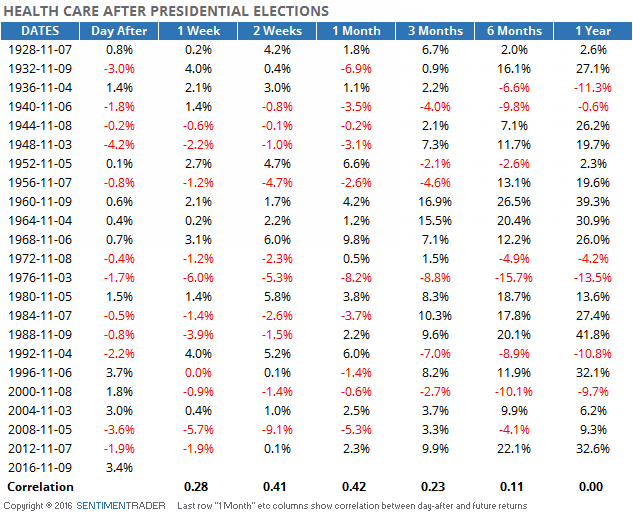
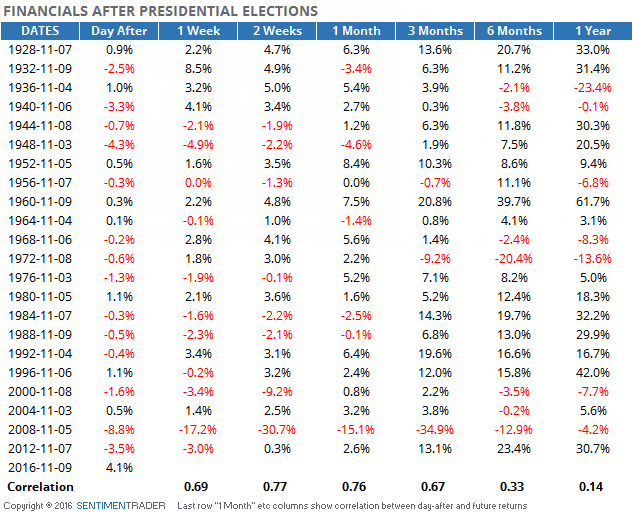
That tended to be the case with the major S&P 500 sectors, as well. They had strongly positive correlations between the initial post-election reaction and returns over the next month. That bodes well for financials, and not so much for utilities.

20161110_staples

20161110_discretionary

20161110_industrials

20161110_energy

20161110_materials

20161110_technology

20161110_telecom

20161110_utilities

20161110_healthcare

20161110_financials

PRODUCTS
SentimenTrader
Trading Tools
Indicators & Data API
‍
Strategies & Scanner
‍
Research Reports
FREE
RESOUrCES
Simple Backtest
Calculator
Simple Seasonality
Calculator
The Kelly Criterion
Calculator
Sentiment Geo Map
‍
Public Research Reports
‍
Education
Sentiment Indicators
‍
Technical Indicators
‍
Pricing
Bundle pricing
‍
FAQ
‍
Announcements
‍
COMPANY
‍
About
‍
In the News
‍
Testimonials
‍
Client Success Stories
CONTACT
‍
General Inquiries
‍
Media Inquiries
‍
Financial Professionals Inquiries
‍
© 2026 Sundial Capital Research Inc. All rights reserved.
Setsail Marketing
TermsPrivacyAffiliate Program
Risk Disclosure: The information and tools provided are for research and analytical purposes only and are not intended as investment advice. Market analysis involves uncertainty, and outcomes may differ from expectations. Users should conduct their own due diligence and consider their individual circumstances before making any financial decisions. Past performance is not necessarily indicative of future results.

Hypothetical Performance Disclosure: Hypothetical performance results have many inherent limitations, some of which are described below. No representation is being made that any account will or is likely to achieve profits or losses similar to those shown; in fact, there are frequently sharp differences between hypothetical performance results and the actual results subsequently achieved by any particular trading program. One of the limitations of hypothetical performance results is that they are generally prepared with the benefit of hindsight. In addition, hypothetical trading does not involve financial risk, and no hypothetical trading record can completely account for the impact of financial risk of actual trading. for example, the ability to withstand losses or to adhere to a particular trading program in spite of trading losses are material points which can also adversely affect actual trading results. There are numerous other factors related to the markets in general or to the implementation of any specific trading program which cannot be fully accounted for in the preparation of hypothetical performance results and all which can adversely affect trading results.

Testimonial Disclosure: Testimonials appearing on this website may not be representative of other clients or customers and is not a guarantee of future performance or success.