
Key Growth and Cyclical Sectors Dominate New Highs List

Key points:
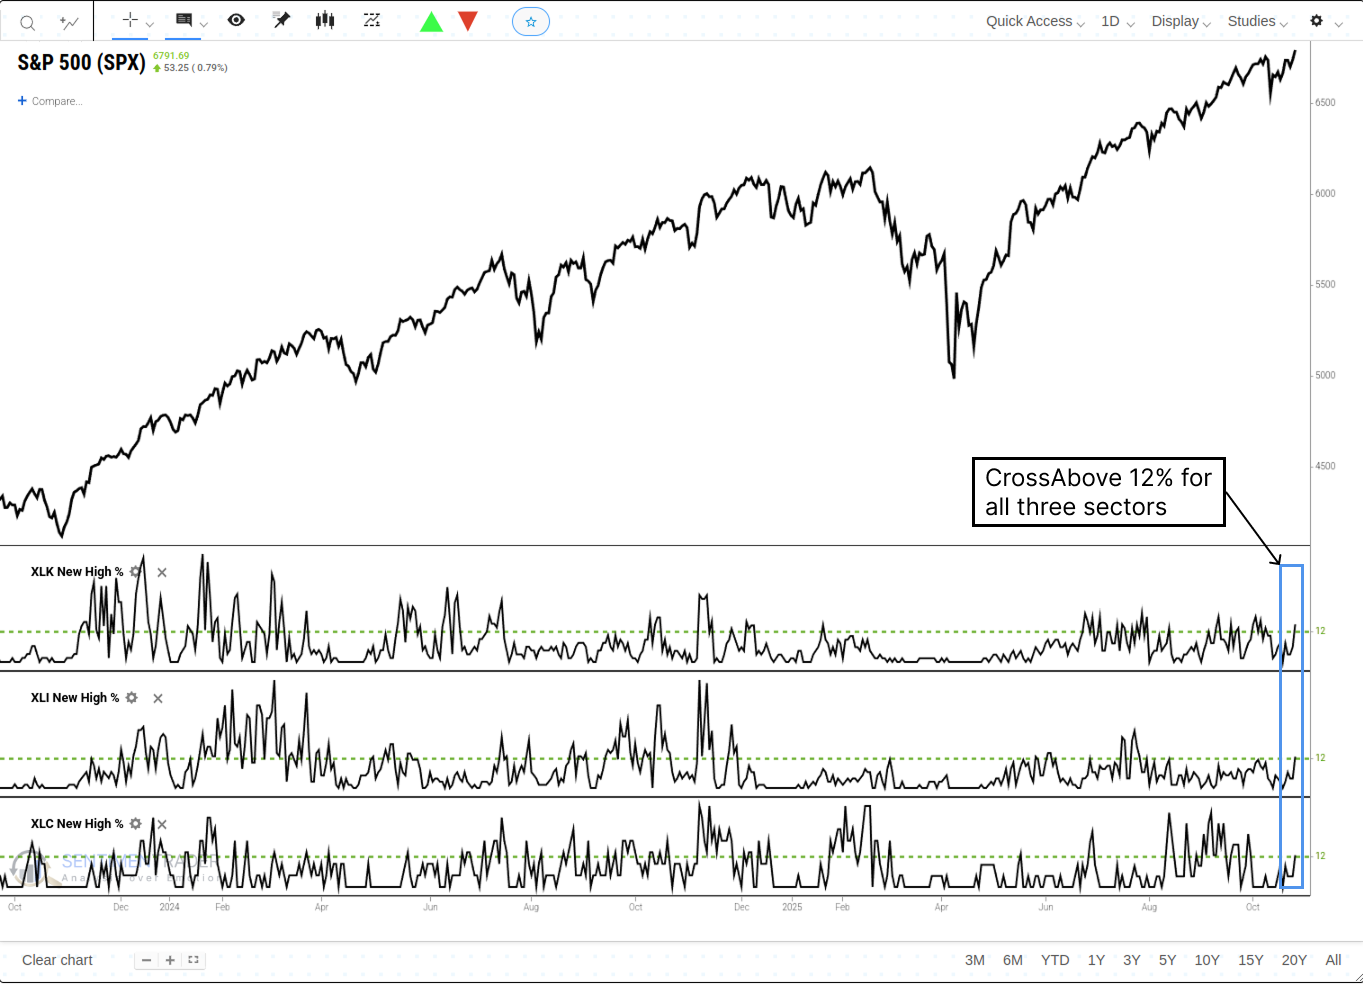
- As the S&P 500 reached a new high, over 12% of stocks in the Technology, Industrials, and Communication Services sectors simultaneously registered a 52-week high.
- Historically, this confluence of signals has preceded strong and consistent returns for the S&P 500 over the subsequent year, with a 94% win rate.
- The sectors driving the signal have historically been among the top performers following this setup.
A bullish market message confirmed by broad participation and trend strength
Cyclical stocks, which are sensitive to economic shifts, continue to exhibit bullish market breadth characteristics, signaling investor confidence in the economic growth outlook.
As the S&P 500 closed at a record high, the number of stocks hitting 52-week highs surged significantly across key leading sectors. For the first time in months, the proportion of stocks reaching 52-week highs simultaneously exceeded 12% in three critical sectors: Technology (XLK), Industrials (XLI), and Communication Services (XLC).
The S&P 500 Trend Score reached a perfect 10, further validating this bullish internal picture. This indicates that all components within the model-which measures trend health across multiple timeframes-are currently in positive territory. This peak trend reading coincides with major sectors hitting new highs, painting a picture of a market potentially firing on all cylinders.
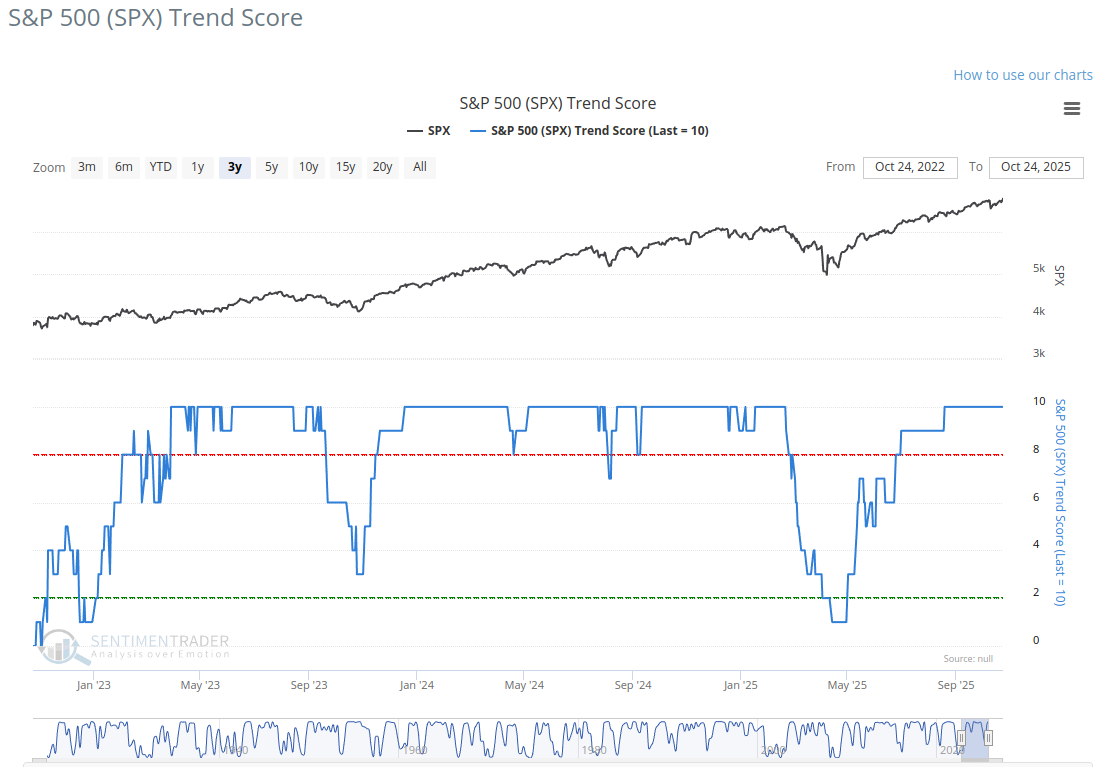
This confluence - confirmed by broad participation from key sectors, and maximum trend score readings - is noteworthy. Does history suggest this powerful combination is a sign of sustainable momentum, or potential exhaustion? For related backtest, click here.
Similar confluence of breadth and trend strength suggests the uptrend is sustainable
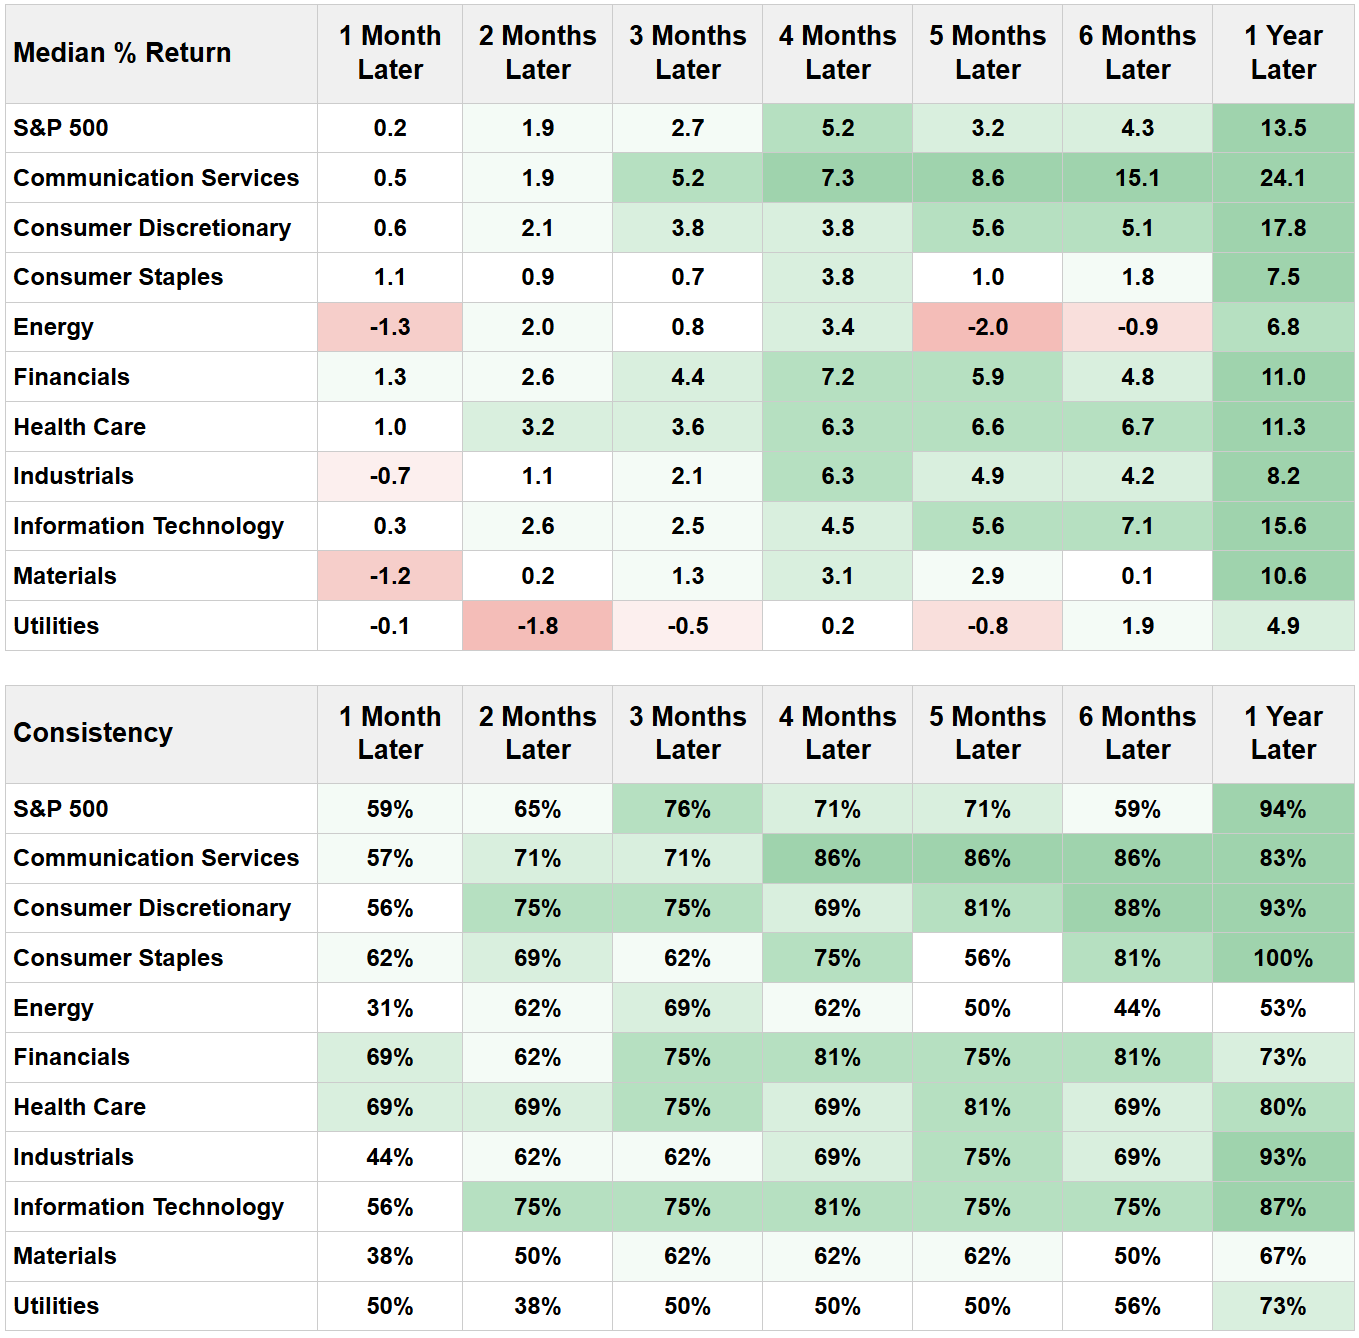
Whenever this confluence of broad participation and maximum trend strength has occurred near a market high, the historical outlook for the S&P 500 has been remarkably positive, especially when looking out over a longer timeframe. While the short-term results (one month later) were mixed, with a median return near zero (+0.2%) and a win rate of only 59%, the picture improves significantly over time.
The standout result is clearly the one-year forward performance. Following these signals, the S&P 500 was higher 94% of the time one year later, with a strong median return of +13.5%.
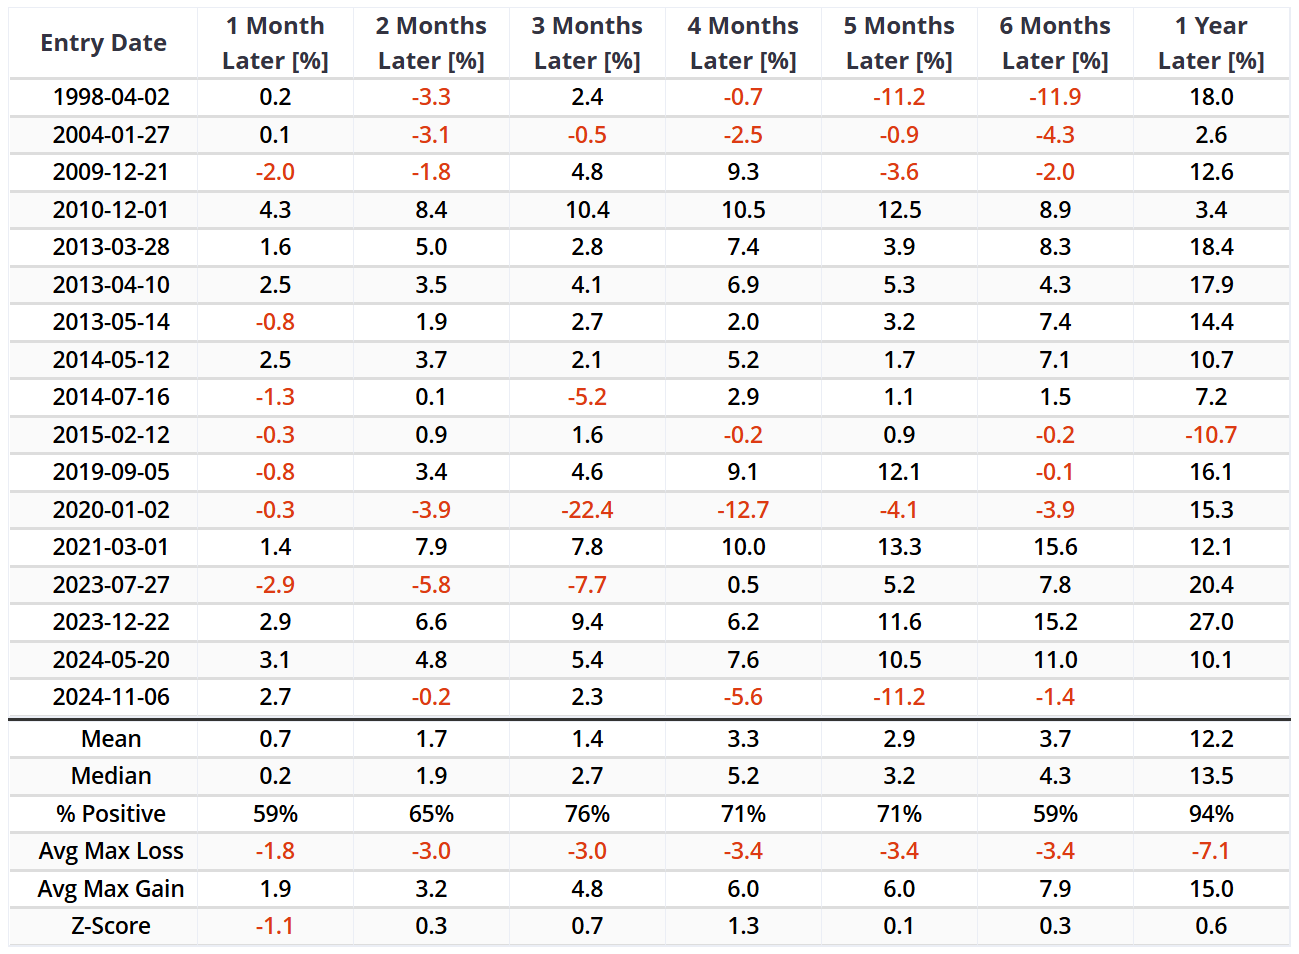
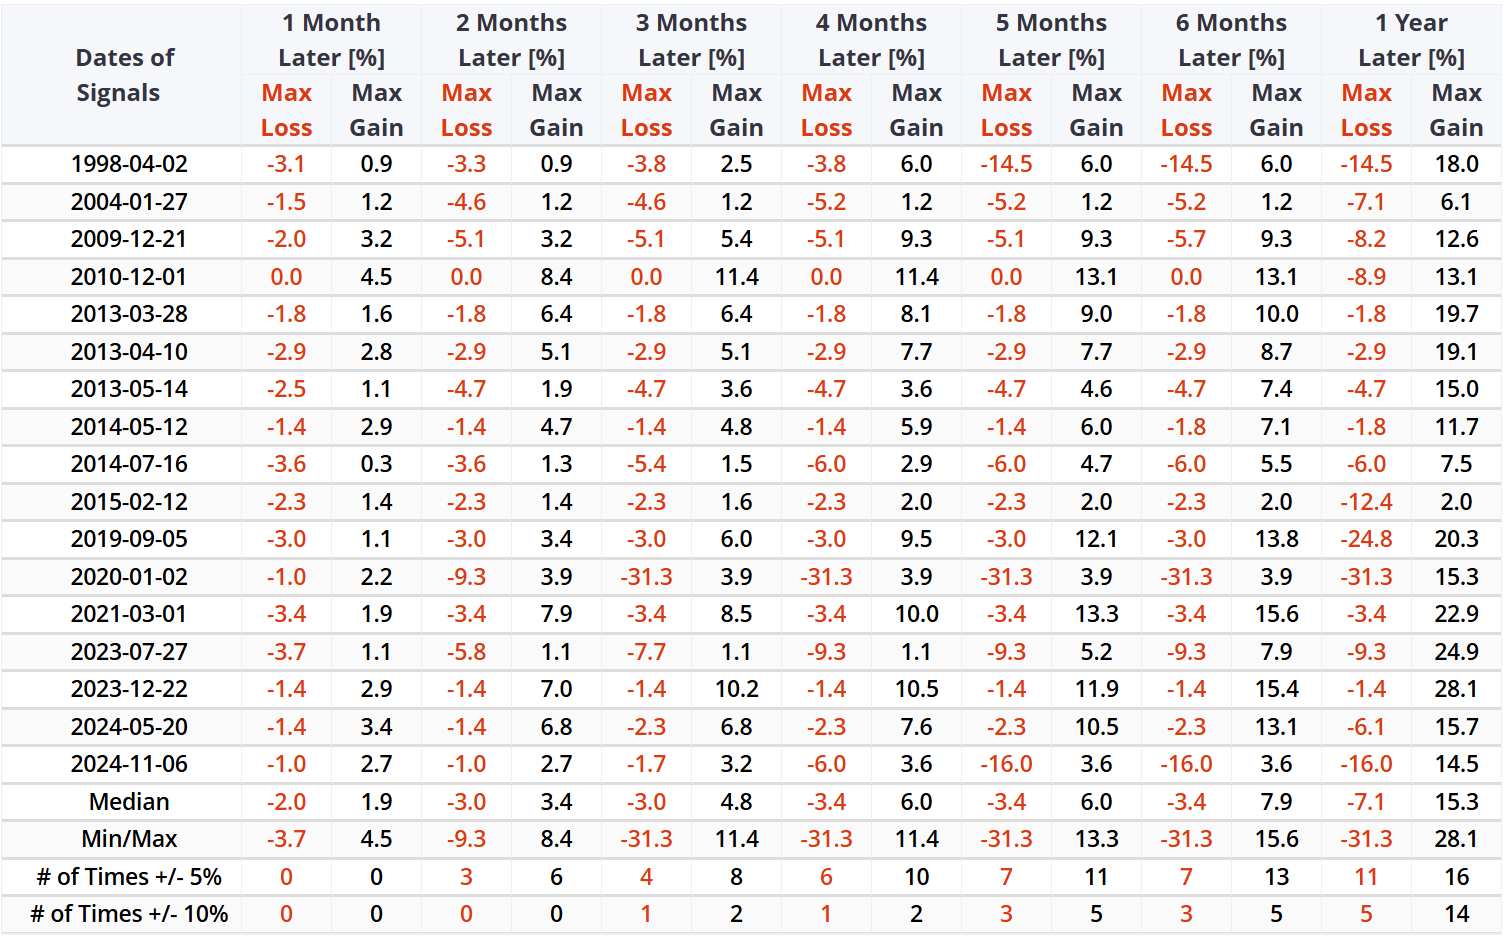
Over the subsequent year, only 5 of the 17 historical precedents experienced a drawdown exceeding -10% within the following year.
Communication Services, Consumer Discretionary (+17.8%) and Information Technology (+15.6%) significantly outperformed the S&P 500 over the next year. This persistent strength in key growth and cyclical sectors underscores the historically bullish nature of the signal.
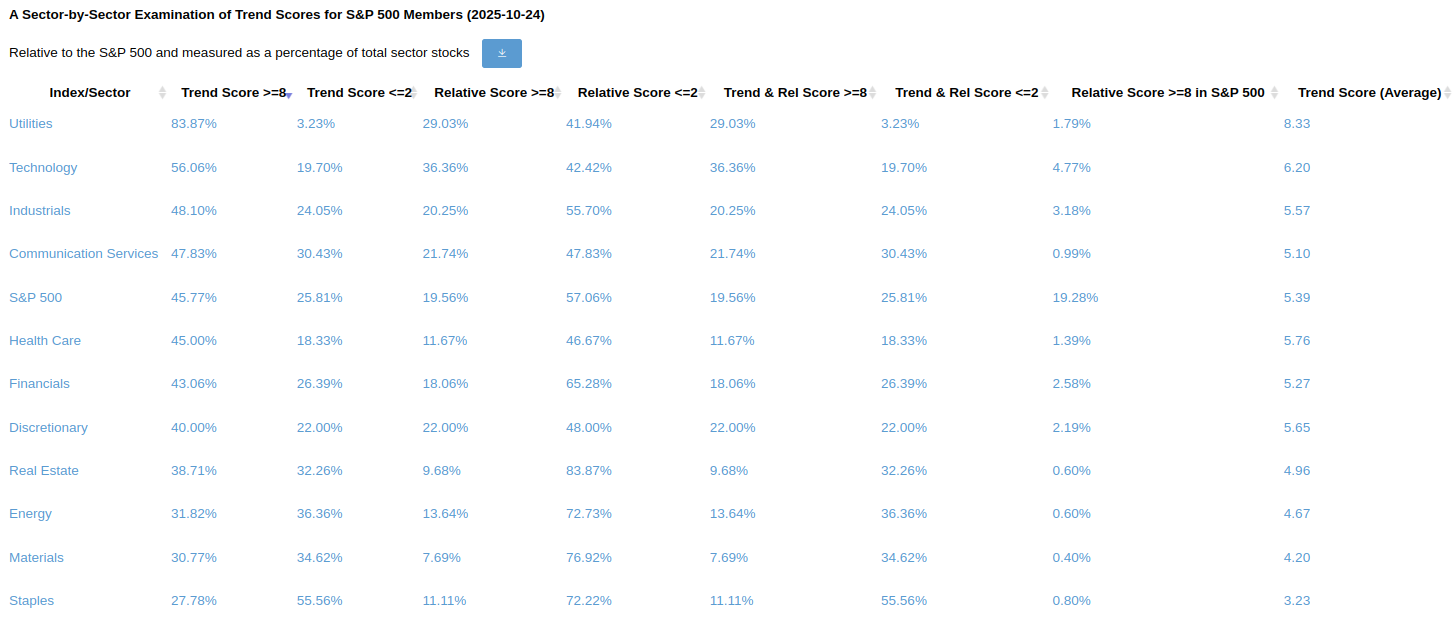
Current Sector Trend Scores and Leading Stocks
A closer look at individual stocks within each sector reveals that Communication, Information Technology, and Industrials boast favorable absolute and relative trend scores, offering ample opportunities for investors.
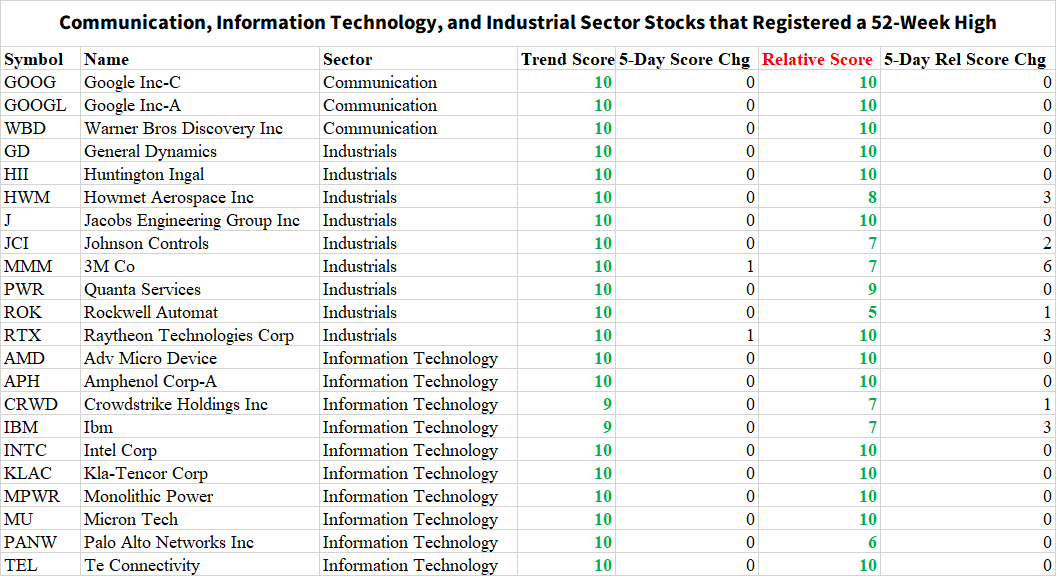
The following table lists each stock in the Communication, Information Technology, and Industrials sectors that reached a 52-week high last Friday, along with its absolute and relative trend scores. All of these stocks have positive scores, with most surpassing a bullish threshold of 8 or higher.
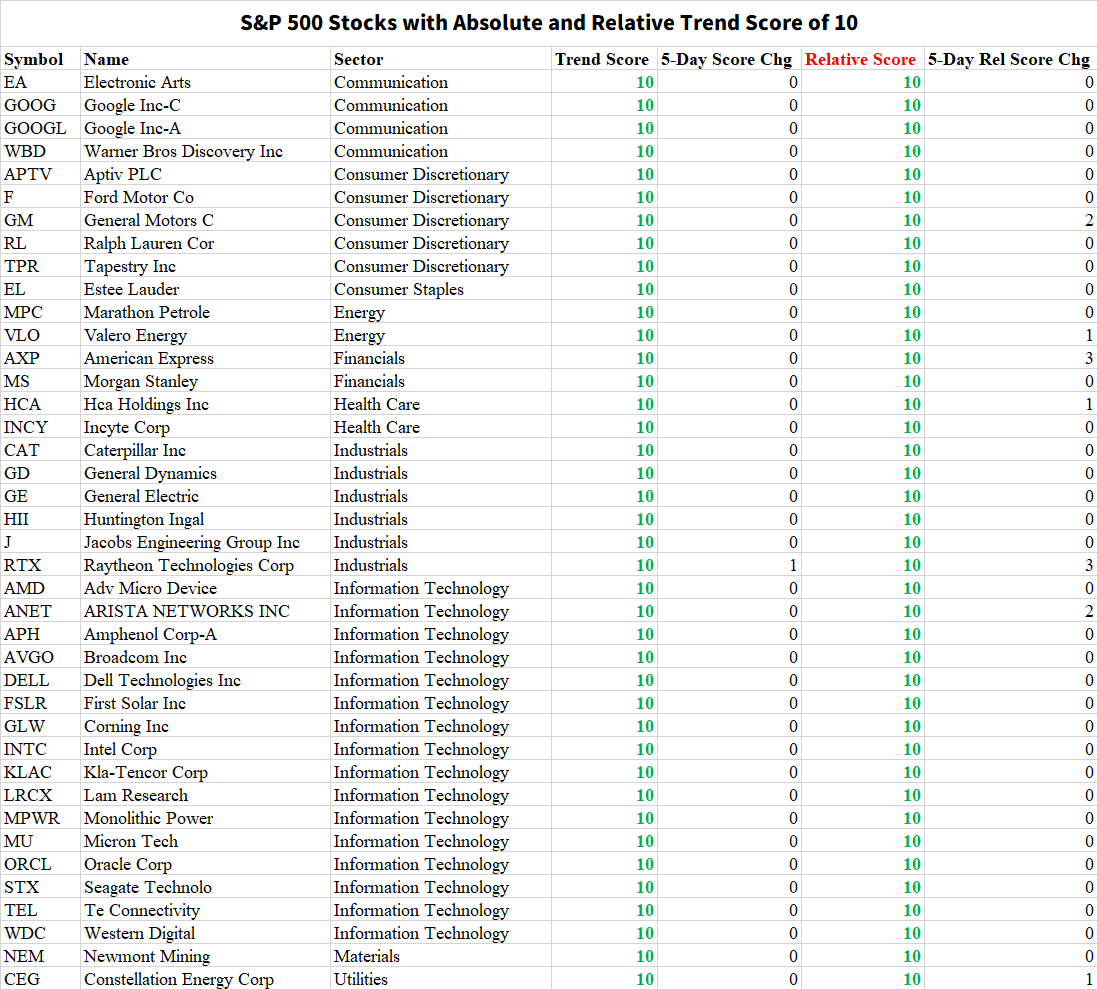
The following table contains all S&P 500 stocks with a perfect absolute and relative trend score of ten. Though cyclical and growth stocks dominate the list, investors adopting a more balanced approach can uncover opportunities in other sectors.
A favorable seasonal period
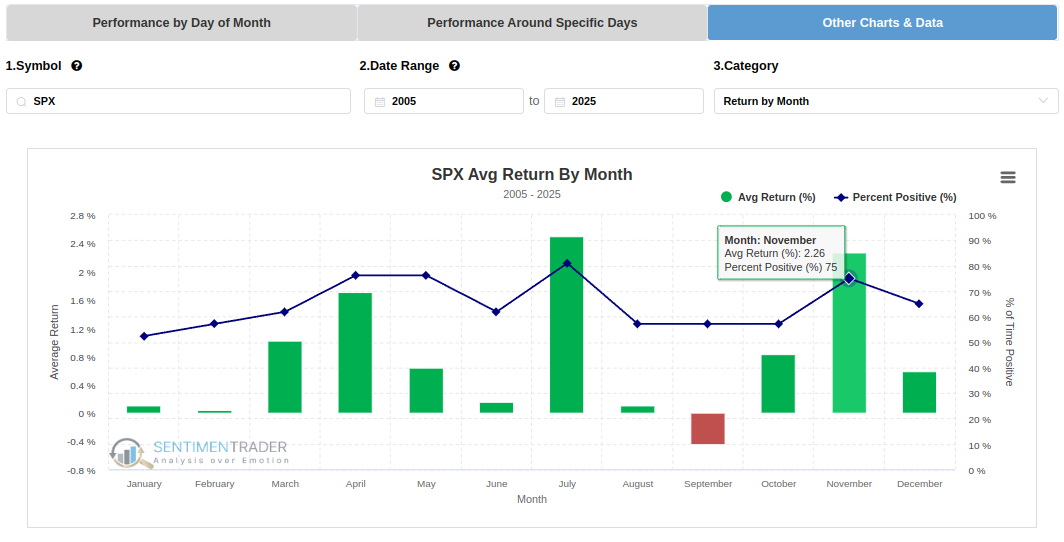
Adding another layer to the current market picture is seasonality. As we move into the final months of the year, the S&P 500 is entering what has historically been a very favorable period. Based on data from 2005-2025, November stands out as the strongest month of the year for the index, boasting an average return of +2.26% and showing positive results 75% of the time. This strong seasonal tendency could provide an additional tailwind for the market in the coming weeks.
What the research tells us...
The S&P 500 is hitting new highs and breadth is expanding significantly across key growth and cyclical sectors (Technology, Industrials, Communication Services). While short-term gains are not guaranteed, the S&P 500 has shown exceptional consistency over the long term, rising 94% of the time over the subsequent year with a favorable risk profile. Adding to this picture, the market is now entering a seasonally strong period, with November historically being the best-performing month. Broad-based strength combined with favorable seasonality has historically been indicative of a sustainable uptrend.