
Key currency flashes a warning for commodities

Key Points
- The Australian Dollar has a long history of tracking closely to the price of a basket of commodities
- Tracking the trend of the Aussie dollar can give valuable clues regarding the future trend of commodities as an asset class
- After 16 months in a bullish trend, the Aussie dollar closed November below a critical moving average - in turn flashing a warning sign for commodities
Aussie Dollar versus its 24-month moving average
The top clip in the chart below displays a monthly chart of the Australian Dollar with its 24-month moving average. The bottom clip shows the monthly chart of GSG, an ETF that tracks the Goldman Sachs Commodity Index.
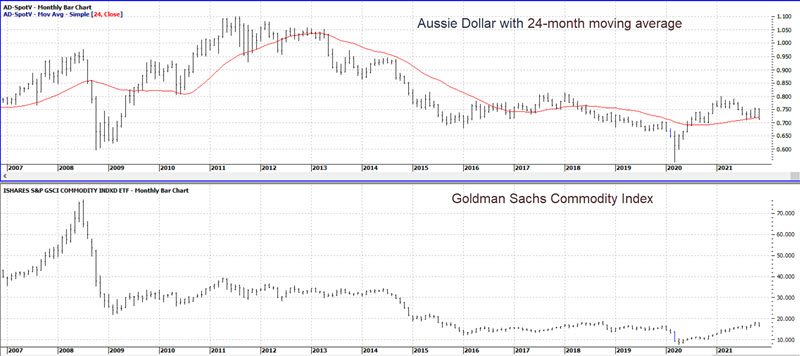
Two key things to note:
- The Goldman Sachs Commodity Index tends to rise when the Aussie Dollar is above its 24-month average and vice versa.
- The Aussie Dollar closed November below its 24-month moving average for the first time July 2020.
In the 16 months since July 2020, the Goldman Sachs Commodity Index has advanced roughly +53%. How significant is this signal? Let's take a look at the history.
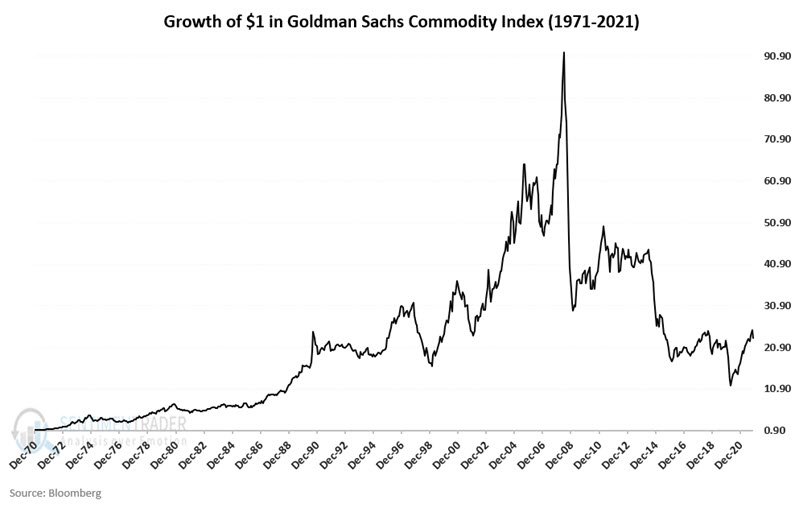
The Goldman Sachs Commodity Index (GSCI) and the Aussie dollar's trend
The chart below displays the growth of $1 invested in the GSCI starting in January 1973. In that time, $1 grew to $13.44 - albeit with some massive price swings along the way.
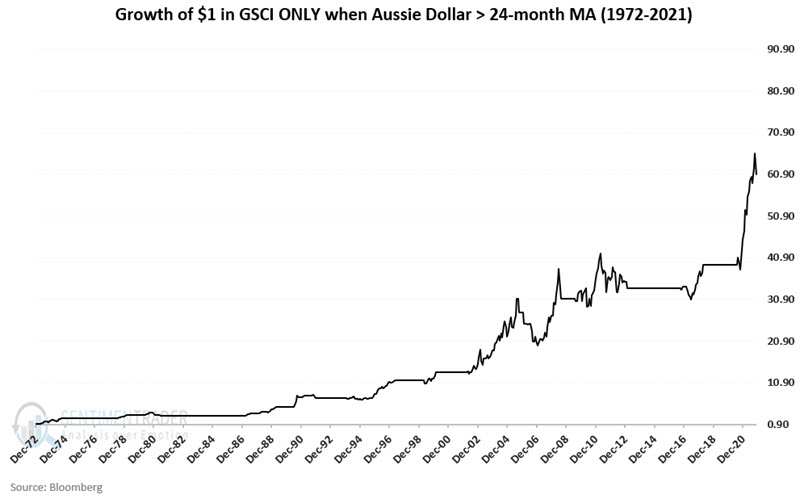
The chart below shows the growth of $1 invested in the GSCI only when the Aussie dollar closed the previous month above its 24-month moving average. That $1 grew to $60.87, a return of +5,987%.
GSCI when Aussie Dollar is below its 24-month moving average
The chart below shows the growth of $1 invested in the GSCI only when the Aussie dollar closed the previous month below its 24-month moving average. Here, that $1 declined in value to just $0.22, a return of -78%.
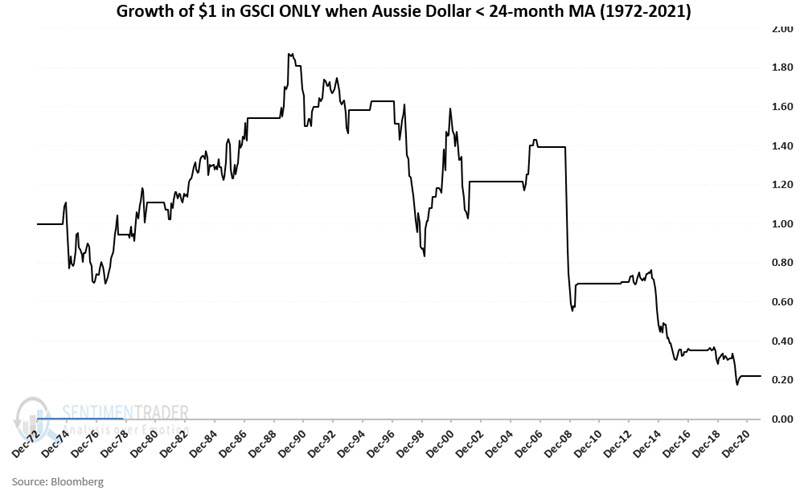
A close look at the chart reveals that a bearish signal from this indicator has at times been followed by rising commodity prices - particularly in the 1980s and the early 2000s. So, it should not be assumed that the latest cross by the Aussie Dollar below its 24-month average is a death sentence for commodities. Still, results in recent years have been pretty abysmal.
What the research tells us…
Commodities as an asset class have performed vastly better over the past five decades when the Aussie Dollar was above its 24-month moving average. The Aussie Dollar just closed back below its 24-month moving average and while this by no means guarantees that commodities are doomed to decline, it removes a very favorable factor from the bullish side of the ledger.