Keeping an eye on Gold

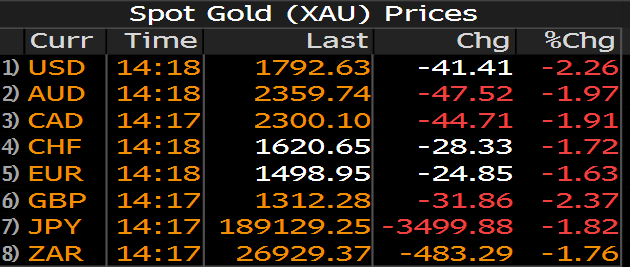
As the table below shows, Gold is having a rough day in several currencies. While gold prices will generally move in lockstep across various currencies, sometimes a basket provides an early heads up to a developing trend. A weight-of-the-evidence approach is always preferable when possible. One technique I like is measuring the average distance from a 252-day high for a group of securities. The method allows me to create a definable threshold for a cross above or below type of signal.
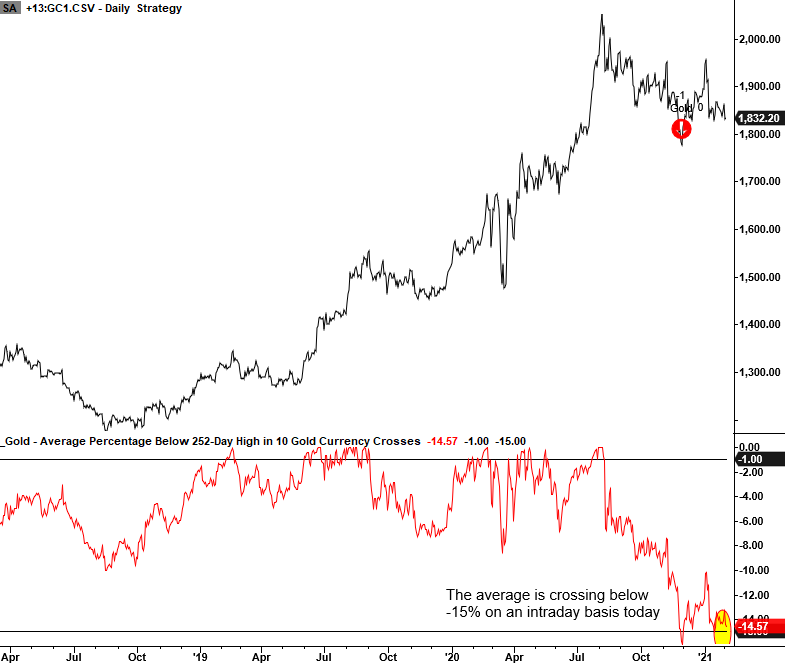
As I write this note, Gold, averaged across ten currencies, is crossing below the -15% threshold from a 252-day high.
Let's take a look at Gold's performance when this scenario has occurred throughout history.
Chart Example
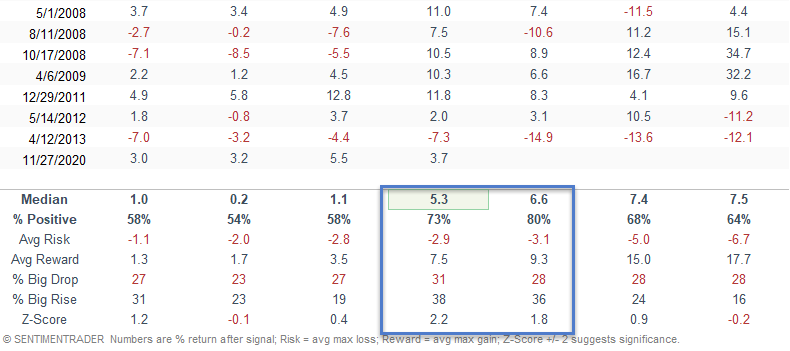
Signal Performance
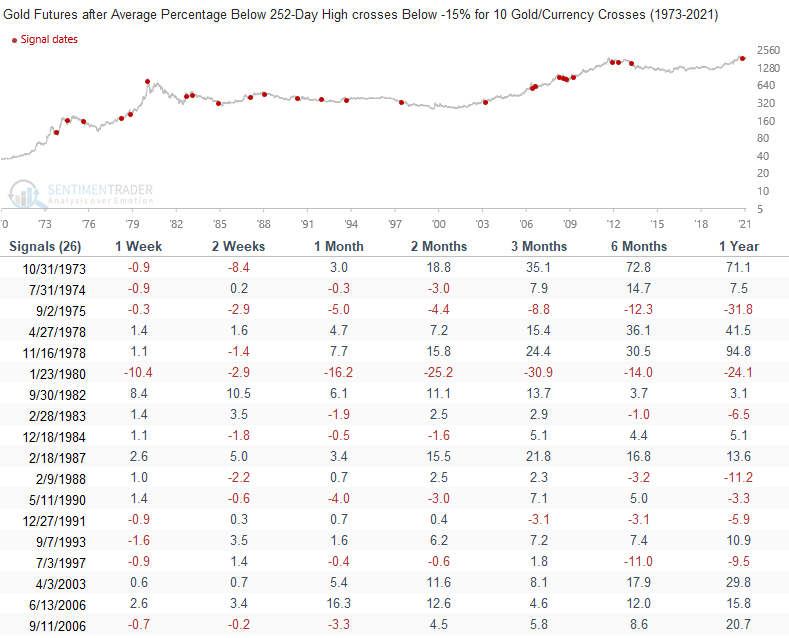
Gold's performance is slightly better in the 1-4 week timeframe versus the study period and very solid in the 2-3 month window.
Signal Performance
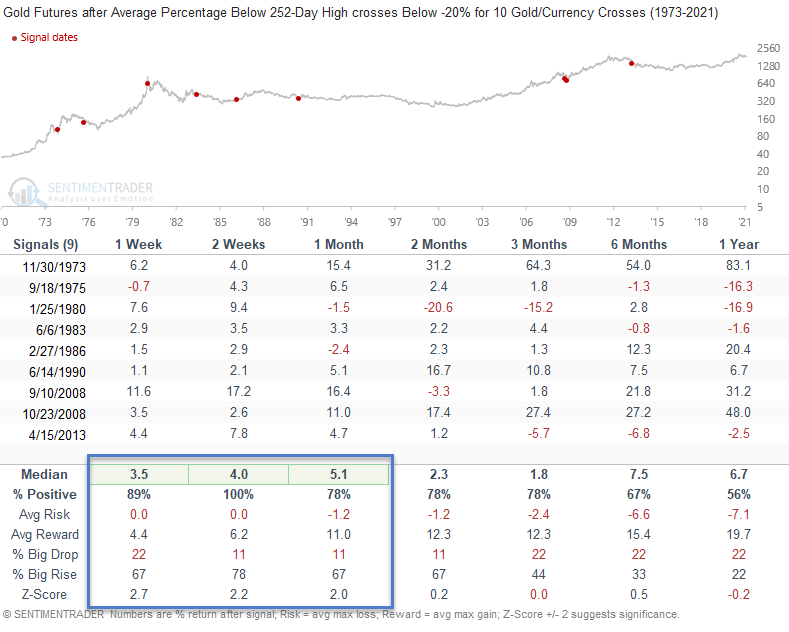
Let's take a look at the same signal with a cross below -20%. As the table below shows, results are robust in the 1-4 week timeframe and continue to be strong in the 2-3 month window. Can anyone say mean reversion?