Keeping an Eye on Corn
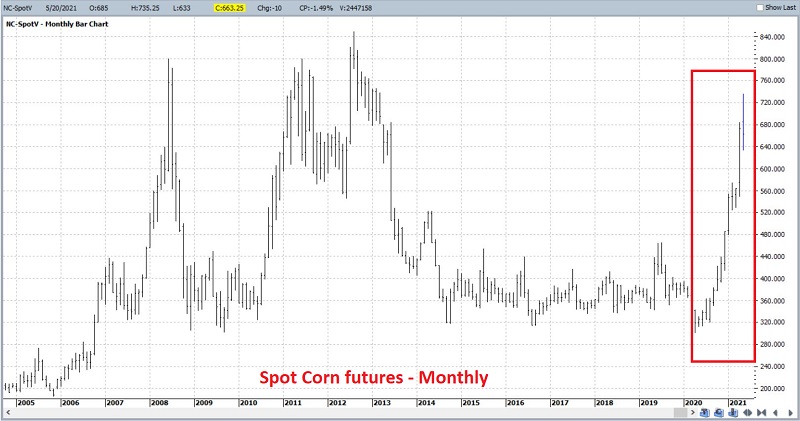
The corn market has been one of the top-performing commodities markets so far in 2021. As you can see in the monthly chart of spot corn futures prices below (courtesy of ProfitSource by HUBB), the rally since August 2020 has been fairly relentless.
THE SEASONAL TENDENCY
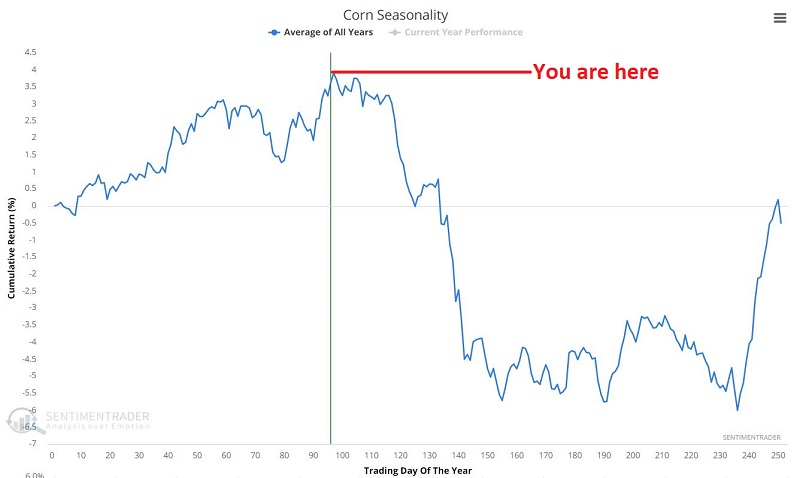
Will this rip-roaring bull market continue? It is certainly possible. Still, history suggests that the next several months could offer some strong seasonal headwinds. To wit, the chart below displays the annual seasonality trend for corn. As you can see, we are about to enter a seasonally unfavorable period that typically lasts into mid-August.
It is important to remember that seasonality charts display previous "tendencies" and DO NOT serve as a "roadmap." Nevertheless, the seasonal trend for corn suggests caution in the months ahead.
PREVIOUS PERFORMANCE DURING UNFAVORABLE PERIOD
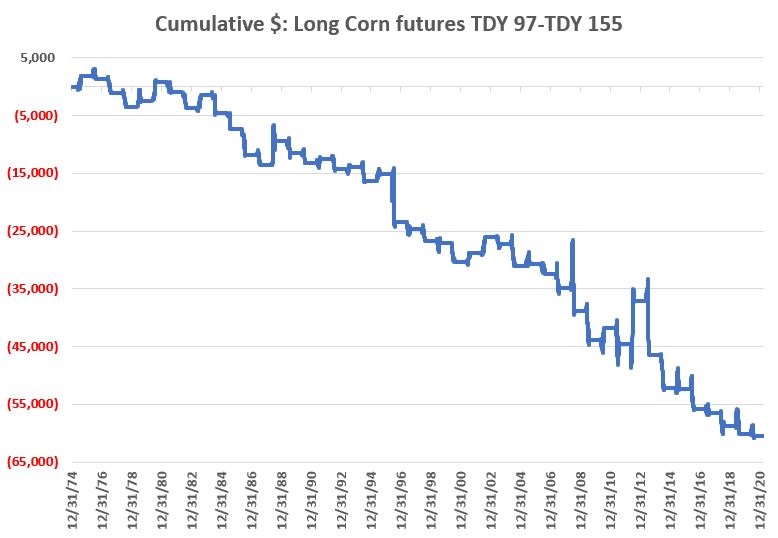
The chart below displays the hypothetical $ +(-) achieved by holding long a 1-lot of corn futures every year SINCE 1975 between:
- The end of trading day #97 and the end of trading day # 155.
As you can see, the results are not pretty. Still, one cannot simply assume that corn is doomed to decline in the months ahead "this time around." To illustrate, let's take a closer look at the year-by-year numbers.
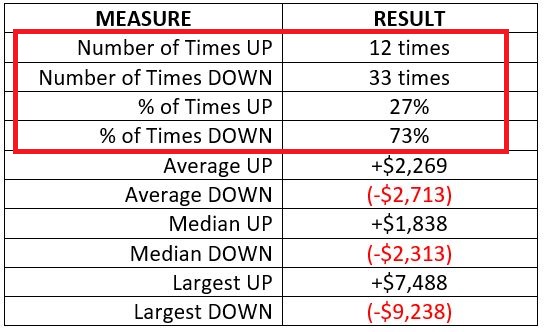
The table below displays a summary of the results.
The key takeaways from the chart above are:
- Corn has shown a strong tendency to decline during this period (73% of the time down)
- The average and median loss are larger than the average and median gain (another sign of consistently significant weakness)
- Despite all of this, a decline is NOT a "sure thing" (27% of the time UP and the largest gain of +$7,488)
A WARNING SIGN TO LOOK FOR: CORN OPTIX
The chart below displays those rare occasions when the 100-day average of Corn Optix dropped from above to below 72%.
Note the extent of the weakness across all timeframes, particularly 3 months and out.
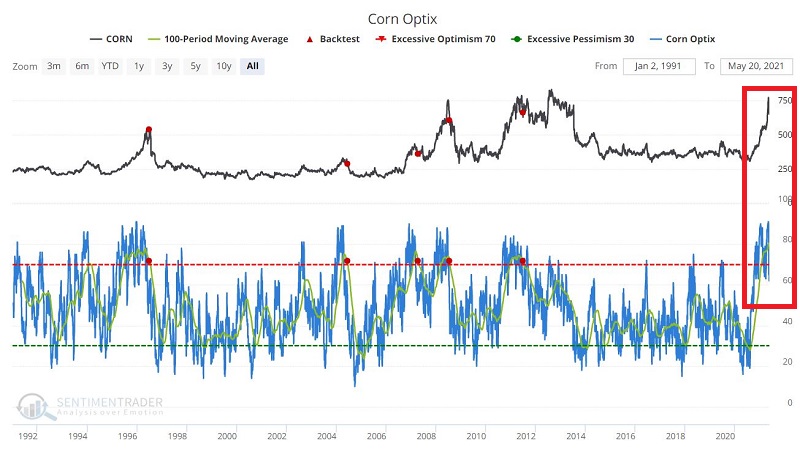
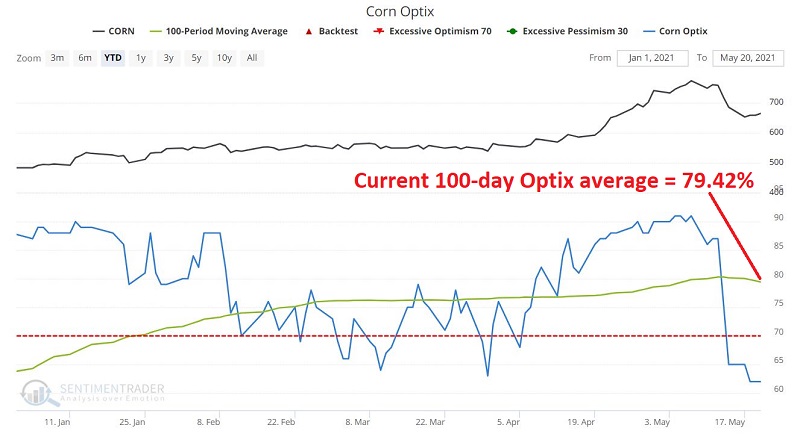
The chart below "zooms in" on the current status of this indicator. Note that the 100-day average for Optix is just over 79%. However, given the recent plunge in daily Optix readings, the 100-day average could decline sharply soon and trigger a new "drop below 72%" signal.
SAVING THE SCAN FOR FUTURE USE
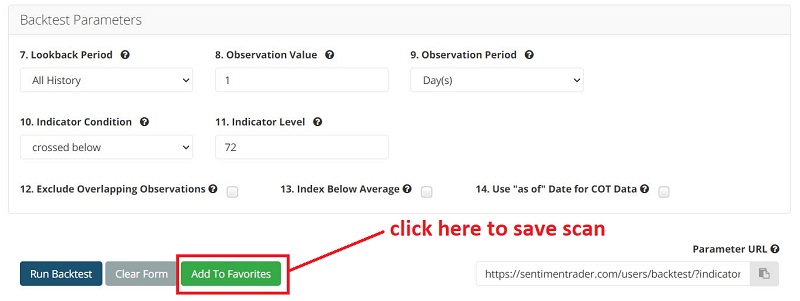
You can duplicate this test by clicking this link and then scrolling down and clicking "Run Backtest."
You can Save this scan by:
- Clicking "Add to Favorites"
- Typing in a Name such as "Corn 100-day Optix Average cross below 72%"
- Clicking "Save Favorite"
SUMMARY
We presently have an ominous combination of an impending:
- Unfavorable seasonal period
- Unfavorable signal from Corn Optix
Still, none of the information above guarantees weakness for corn in the months immediately ahead. The key is to remember that there are never any "sure things," only "potential opportunities."
The real point is that traders who wish to play:
- The long side of the corn market need to pay careful attention to risk in the months ahead
- The short side of the corn market need to decide what will trigger them to enter a short position and how much risk they are willing to assume


