Data &
Technology
Research
Reports
Report Solutions
Reports Library
Actionable
Strategies
Free
Resources
Simple Backtest Calculator
Simple Seasonality Calculator
The Kelly Criterion Calculator
Sentiment Geo Map
Public Research Reports
Free Webinar
Pricing
Company
About
Meet Our Team
In the News
Testimonials
Client Success Stories
Contact
Log inLoginSign up
< BACK TO ALL REPORTS

Keeping an eye on Copper

Dean Christians
2021-04-05
Let's review the bullish copper signal from 2/18/21 to see how it compares to the other historical instances now that 30 days have passed.

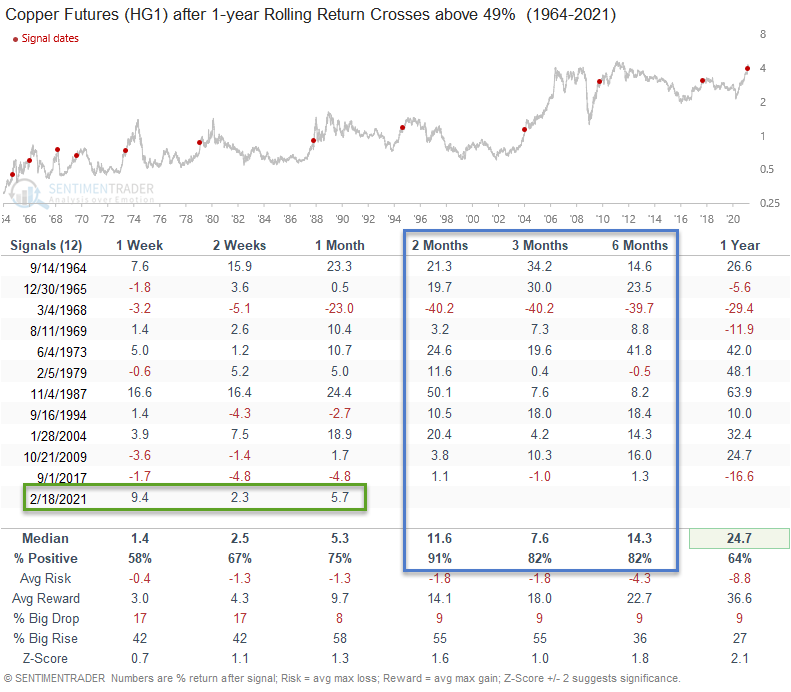
In a note on 2/19/21, I shared the potential outlook for several assets after a 49% surge in the 1-year rolling return for copper. Interestingly, copper had one of the best forward return profiles in the 2-6 month timeframe, even after a significant price surge.

As I write this note, copper futures are up 3.75% on the day. Let's review copper's performance since the signal on 2/18/21.

Copper Performance Since 2/18/21

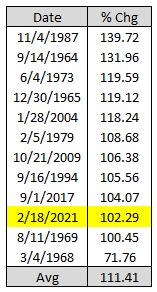
The current copper signal got off to a fast start with the second-best performance in the 1-week timeframe relative to other historical instances. However, the one-week timeframe also marked the top in copper as the commodity peaked on 2/25 and has subsequently entered into a consolidation/correction phase.

Copper after 30 Days (Indexed to 100)

Suppose we focus on performance from the 2/18/21 signal date to the most recent close on 4/1/21. In that case, one can see that the consolidation/correction in copper has pushed performance results down to one of the weaker instances over 30 days.

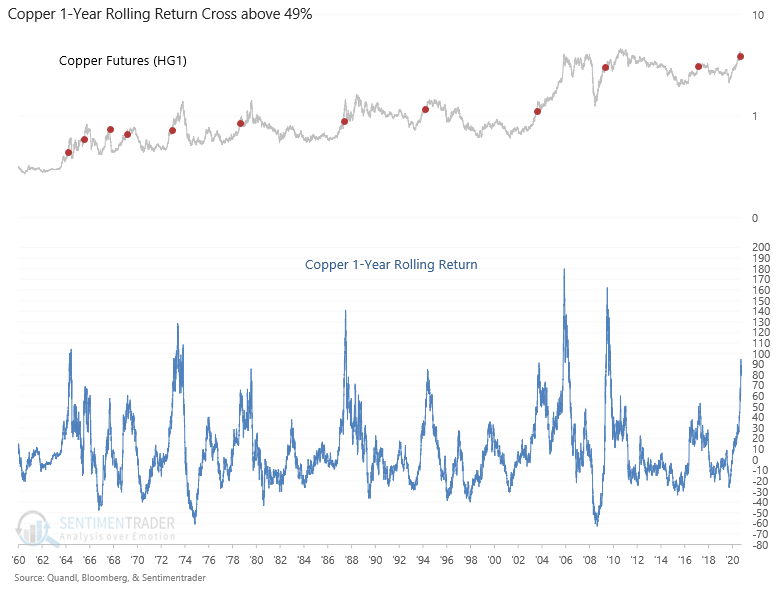
Copper Rolling Return Chart

The rolling return chart has moved higher from the signal date but has subsequently moved down with the 30-day consolidation/correction. While the rolling return is up a significant amount, I would note that copper has not reached a level on par with other major price peaks.

Current Day Chart

The price spike in February pushed the RSI for copper up to a very overbought level of 88. One should not have been surprised by the current consolidation/correction phase. More importantly, I would note that the RSI has failed to reach an oversold level with the pullback in price, which is a sign of a strong uptrend. It is now turning up with today's price strength. The chart looks constructive.

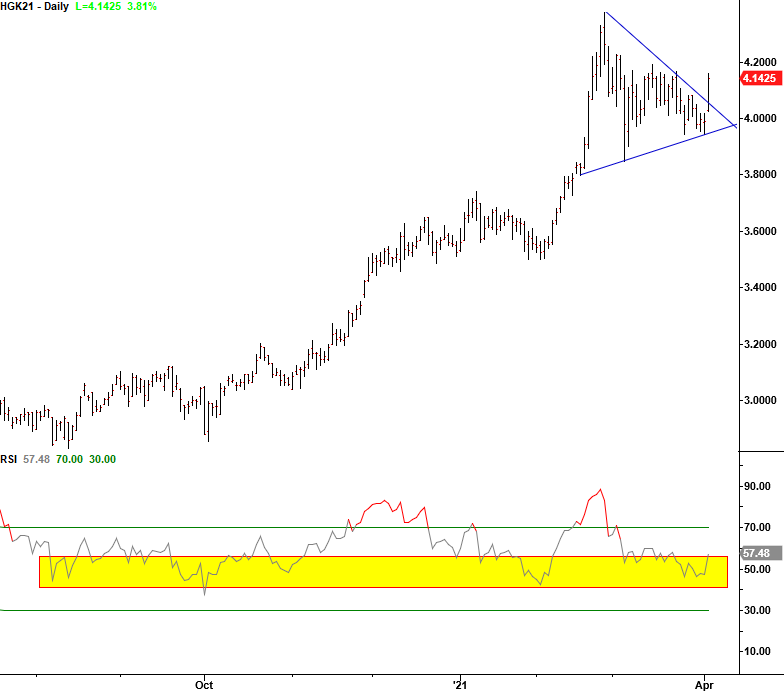
Conclusion: The copper consolidation/correction within an ongoing uptrend looks constructive. A significant break in price, whereby the RSI falls below 30, would lead me to reassess the current copper bull market.  

For a more detailed trading plan on the same signal, please see Jay's note from 2/24/21.

Sorry, you don't have access to this report

Upgrade your subscription plan to get access
Go to Dasboard
DATA &
TECHnologies
IndicatorEdge
‍
BackTestEdge
‍
Other Tools
‍
DataEdge API
RESEARCH
reports
Research Solution
‍
Reports Library
‍
actionable
Strategies
Trading Strategies
‍
Smart Stock Scanner
‍
FREE
RESOUrCES
Simple Backtest
Calculator
Simple Seasonality
Calculator
The Kelly Criterion
Calculator
Sentiment Geo Map
‍
Public Research Reports
‍
Free Webinar
COMPANY
‍
About
‍
Meet our Team
‍
In the News
‍
Testimonials
‍
Client Success Stories
Pricing
Bundle pricing
‍
Announcements
‍
FAQ
© 2024 Sundial Capital Research Inc. All rights reserved.
Setsail Marketing
TermsPrivacyAffiliate Program
Risk Disclosure: Futures and forex trading contains substantial risk and is not for every investor. An investor could potentially lose all or more than the initial investment. Risk capital is money that can be lost without jeopardizing ones’ financial security or life style. Only risk capital should be used for trading and only those with sufficient risk capital should consider trading. Past performance is not necessarily indicative of future results.

Hypothetical Performance Disclosure: Hypothetical performance results have many inherent limitations, some of which are described below. No representation is being made that any account will or is likely to achieve profits or losses similar to those shown; in fact, there are frequently sharp differences between hypothetical performance results and the actual results subsequently achieved by any particular trading program. One of the limitations of hypothetical performance results is that they are generally prepared with the benefit of hindsight. In addition, hypothetical trading does not involve financial risk, and no hypothetical trading record can completely account for the impact of financial risk of actual trading. for example, the ability to withstand losses or to adhere to a particular trading program in spite of trading losses are material points which can also adversely affect actual trading results. There are numerous other factors related to the markets in general or to the implementation of any specific trading program which cannot be fully accounted for in the preparation of hypothetical performance results and all which can adversely affect trading results.

Testimonial Disclosure: Testimonials appearing on this website may not be representative of other clients or customers and is not a guarantee of future performance or success.