Products
SentimenTrader Trading Tools
‍
Backtest Engine
My Trading Toolkit
Correlation Analysis
Seasonality
Market Prediction
Indicators & Data API
‍
Proprietary Indicators & Charts
Market Data API
Strategies & Scanner
‍
50+ Trading Strategies
Smart Stock Scanner
Smart Option Scanner
Research Reports
‍
Research Solutions
Reports Library
Free Resources
Simple Backtest Calculator
Simple Seasonality Calculator
The Kelly Criterion Calculator
Sentiment Geo Map
Public Research Reports
Education
Sentiment Indicators
Technical Indicators
Pricing
Company
About
In the News
Testimonials
Client Success Stories
Contact
Log inLoginSign up
< BACK TO ALL REPORTS

Just how bullish are Robinhood traders?

Jason Goepfert
2020-05-29
Robinhood has become an increasingly popular outlet for stay-at-home investors - or more likely "gamblers" at this point. The growth in accounts holding leveraged long ETFs has risen quite a bit faster than those holding leveraged short ETFs though that's tapered in recent days.

With a massive spike in people staying at home, the cancellation of virtually every sport, and a shutdown in traditional gambling, there has been a mass movement to trading. Nobody personifies this more than Dave Portnoy, perhaps the most destructive force for individuals' finances extant.

We've documented the rise in trading several times, especially the exponential growth in trades at retail brokerages and the historic volume of speculative options trading.

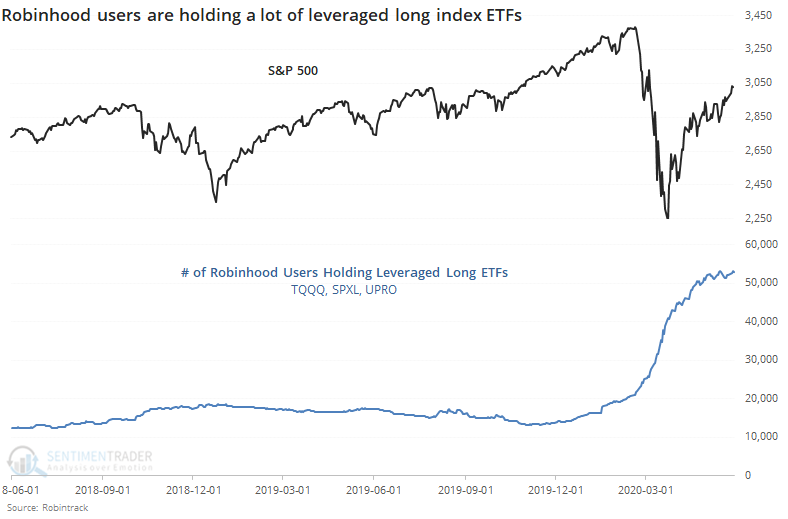
Another popular measure of this newfound love affair with trading is the growth in Robinhood accounts. Robinhood is "a pioneer of commission-free investing, gives you more ways to make your money work harder" and their user growth went exponential in March and April.

Using data from Robintrack, we can see that the number of users holding the most popular leveraged long ETFs has exploded.

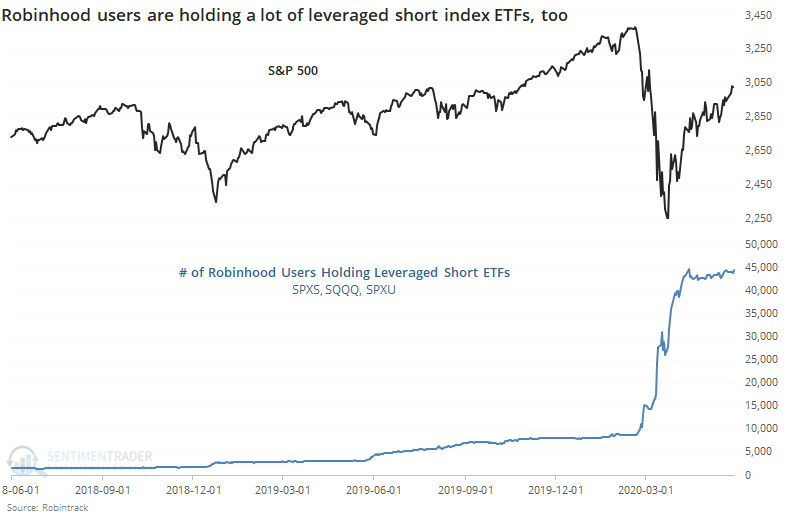
If we just stop there, we'd have to make the assumption that speculation is out of control. It would also be highly misleading since there has also been an explosion in users holding the most popular inverse ETFs. These are funds that rise when stocks fall.

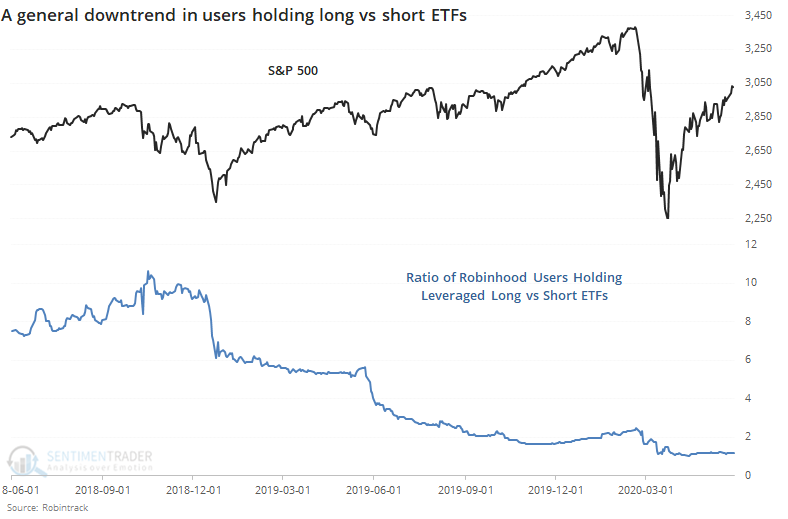
If we look at the ratio of users holding long versus short ETFs, then there has been a clear downtrend, as more and more users have discovered the uses (and pitfalls) of inverse funds.

None of these are very helpful. So, let's look at the 20-day percentage change in users holding leveraged long ETFs minus leveraged short ETFs.

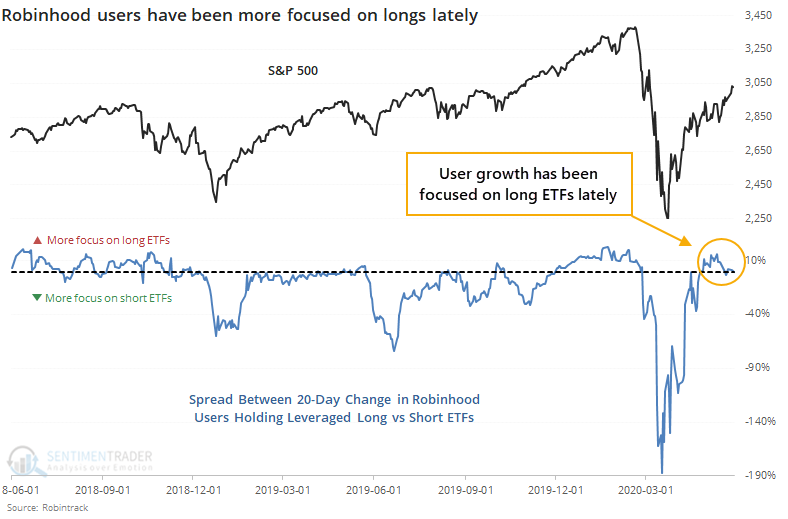
Here, we can see a more useful look at their behavior. When stocks dropped in late 2018, June 2019, and March of this year, there was an explosion of users holding the inverse ETFs relative to those holding long ETFs. It was an effective contrary indicator each time.

The opposite extremes were less clear, as were the extremes themselves. It was rare to see 10% or more growth in users holding long versus short ETFs, and the times it did, it preceded mixed-to-negative returns in the S&P 500.

In recent days, growth in accounts has been about equal between those holding long and short funds. It was skewed heavily toward long ETFs at the beginning of May but even though stocks have rallied since then, user growth has evened out.

We could maybe call this a very slight negative since there was that spike in interest in long funds a few weeks ago, but it's just not a strong enough indicator to consider it an edge.

PRODUCTS
SentimenTrader
Trading Tools
Indicators & Data API
‍
Strategies & Scanner
‍
Research Reports
FREE
RESOUrCES
Simple Backtest
Calculator
Simple Seasonality
Calculator
The Kelly Criterion
Calculator
Sentiment Geo Map
‍
Public Research Reports
‍
Education
Sentiment Indicators
‍
Technical Indicators
‍
Pricing
Bundle pricing
‍
FAQ
‍
Announcements
‍
COMPANY
‍
About
‍
In the News
‍
Testimonials
‍
Client Success Stories
CONTACT
‍
General Inquiries
‍
Media Inquiries
‍
Financial Professionals Inquiries
‍
© 2026 Sundial Capital Research Inc. All rights reserved.
Setsail Marketing
TermsPrivacyAffiliate Program
Risk Disclosure: The information and tools provided are for research and analytical purposes only and are not intended as investment advice. Market analysis involves uncertainty, and outcomes may differ from expectations. Users should conduct their own due diligence and consider their individual circumstances before making any financial decisions. Past performance is not necessarily indicative of future results.

Hypothetical Performance Disclosure: Hypothetical performance results have many inherent limitations, some of which are described below. No representation is being made that any account will or is likely to achieve profits or losses similar to those shown; in fact, there are frequently sharp differences between hypothetical performance results and the actual results subsequently achieved by any particular trading program. One of the limitations of hypothetical performance results is that they are generally prepared with the benefit of hindsight. In addition, hypothetical trading does not involve financial risk, and no hypothetical trading record can completely account for the impact of financial risk of actual trading. for example, the ability to withstand losses or to adhere to a particular trading program in spite of trading losses are material points which can also adversely affect actual trading results. There are numerous other factors related to the markets in general or to the implementation of any specific trading program which cannot be fully accounted for in the preparation of hypothetical performance results and all which can adversely affect trading results.

Testimonial Disclosure: Testimonials appearing on this website may not be representative of other clients or customers and is not a guarantee of future performance or success.