Products
SentimenTrader Trading Tools
‍
Backtest Engine
My Trading Toolkit
Correlation Analysis
Seasonality
Market Prediction
Indicators & Data API
‍
Proprietary Indicators & Charts
Market Data API
Strategies & Scanner
‍
50+ Trading Strategies
Smart Stock Scanner
Smart Option Scanner
Research Reports
‍
Research Solutions
Reports Library
Free Resources
Simple Backtest Calculator
Simple Seasonality Calculator
The Kelly Criterion Calculator
Sentiment Geo Map
Public Research Reports
Education
Sentiment Indicators
Technical Indicators
Pricing
Company
About
In the News
Testimonials
Client Success Stories
Contact
Log inLoginSign up
< BACK TO ALL REPORTS

Jobless claims trigger a bullish signal for stocks

Dean Christians
2023-06-30
Continuing jobless claims cycled from a 52-week high to a 16-week low, triggering a bullish signal for stocks. Similar reversals preceded excellent returns for the S&P 500 and cyclical stocks over medium and long-term horizons. The improvement in employment tends to lift the ISM manufacturing survey.

Key points:

  • Continuing jobless claims cycled from a 52-week high to a 16-week low
  • Similar reversals in continuing claims resulted in excellent returns for the S&P 500
  • Cyclical sectors outperformed defensive ones

An interesting development from one employment data series

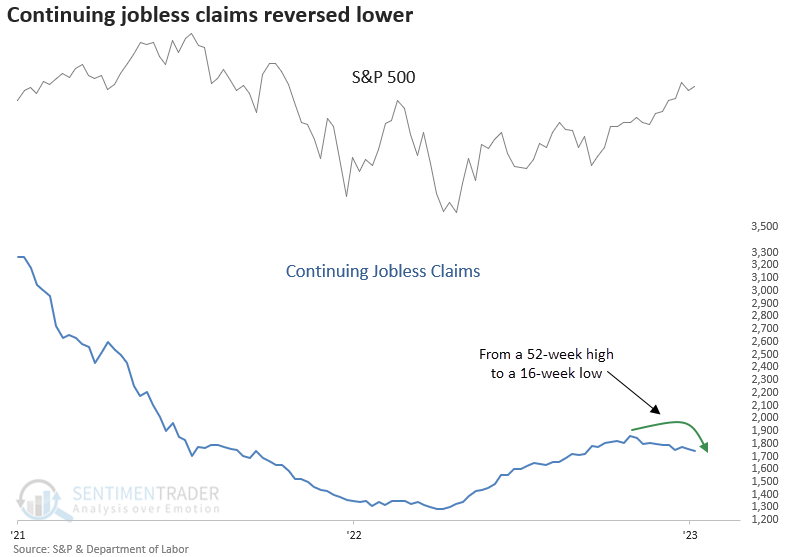
On Thursday, the Department of Labor released the latest weekly jobs data, and both initial and continuing jobless claims declined. 

While the initial claims showed a significant week-over-week plunge, the continuing claims caught my attention. After steadily rising for seven months to a 52-week high in April, continuing claims have now fallen to a 16-week low. The presence of elevated continuing claims can be a sign of sluggish employment and economic growth. So, the reversal to a 16-week low is an interesting development in the debate over a soft or hard landing for the economy. 

Let's assess the outlook for stocks and a manufacturing survey when the continuing jobless claims cycle from a 52-week high to a 16-week low.

Similar reversals in continuing claims preceded positive returns

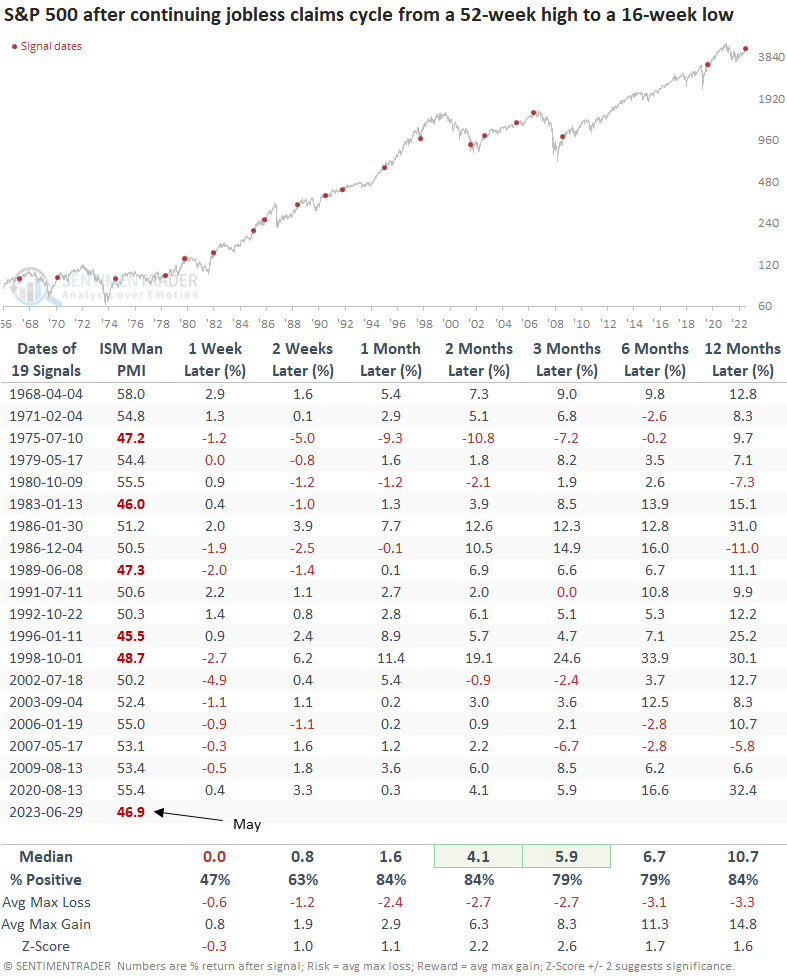
The S&P 500 demonstrates excellent returns and win rates when the continuing claims cycle from a 52-week high to a 16-week low, particularly over medium and long-term horizons. The only notable drawdown occurred in 1975, representing a correction following a substantial rally from the 1974 bottom. 

I used the as-of-release date.

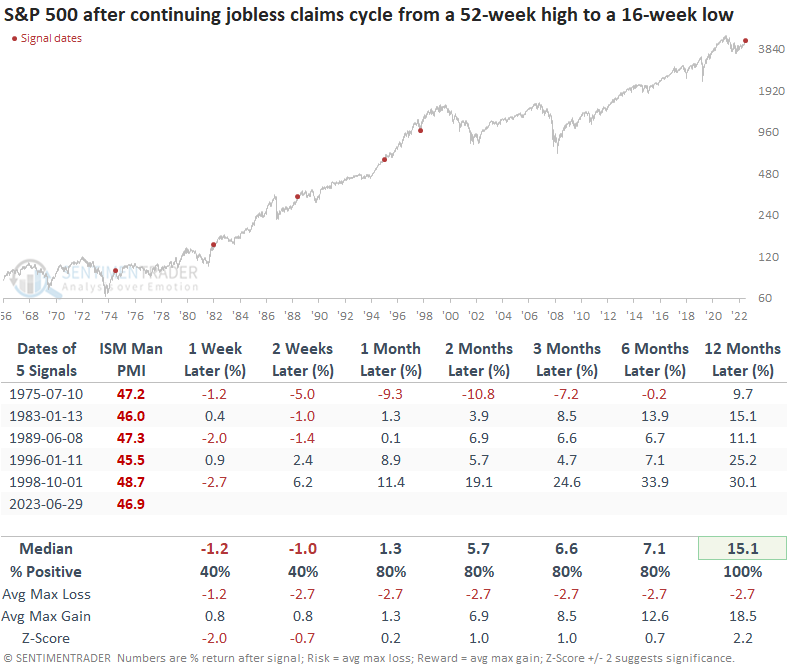
When I isolate the signals associated with a contraction in the ISM Manufacturing PMI, like now, the S&P 500 was higher a year later every time. 

How should one position a portfolio when continuing claims reverse lower?

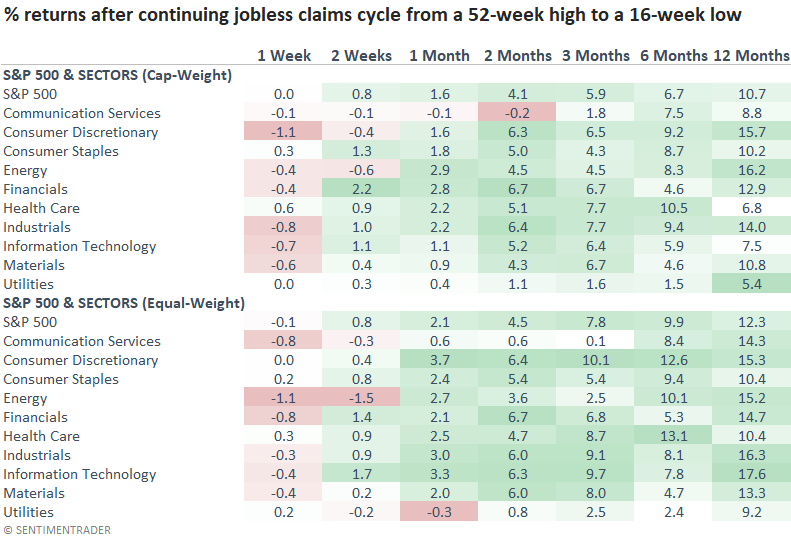
An improvement in the continuing claims suggests one should favor cyclical groups over defensive ones. Remember, historical returns serve as a general guide. It's crucial to utilize relative strength indicators to ensure that current-day trends align with past performance.

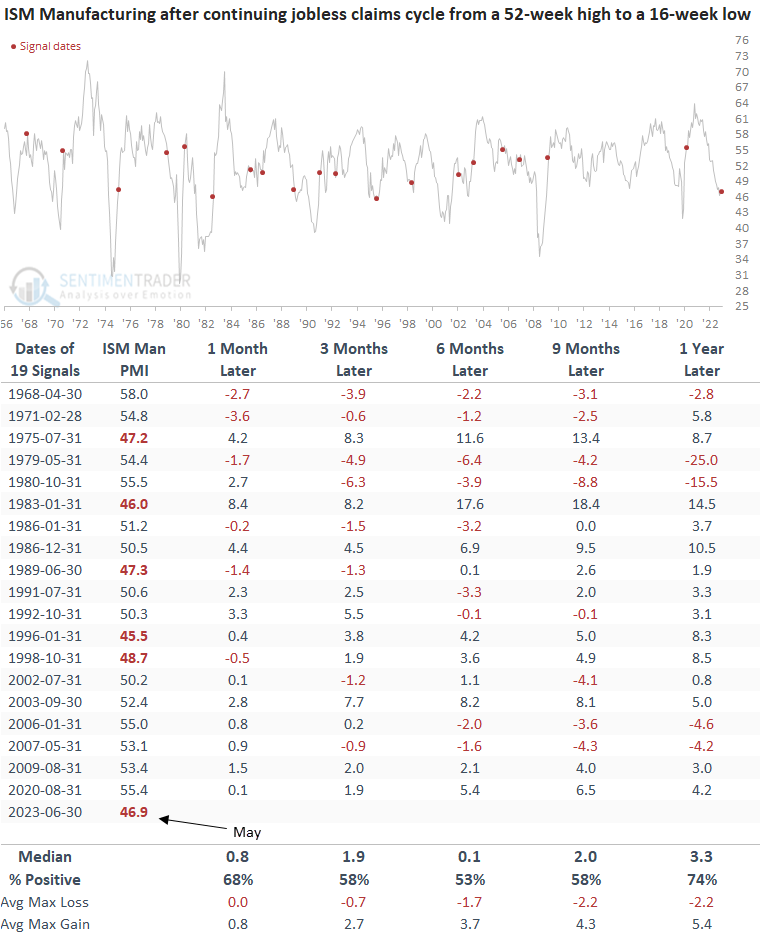
Can an improvement in continuing claims impact the manufacturing sector?

Applying the continuing claims signals to the ISM Manufacturing PMI data reveals a positive correlation, indicating that an improvement in employment data tends to lift the manufacturing survey. The last occurrence of a continuing claims reversal coinciding with an ISM manufacturing PMI survey reading this low dates back to 1996.

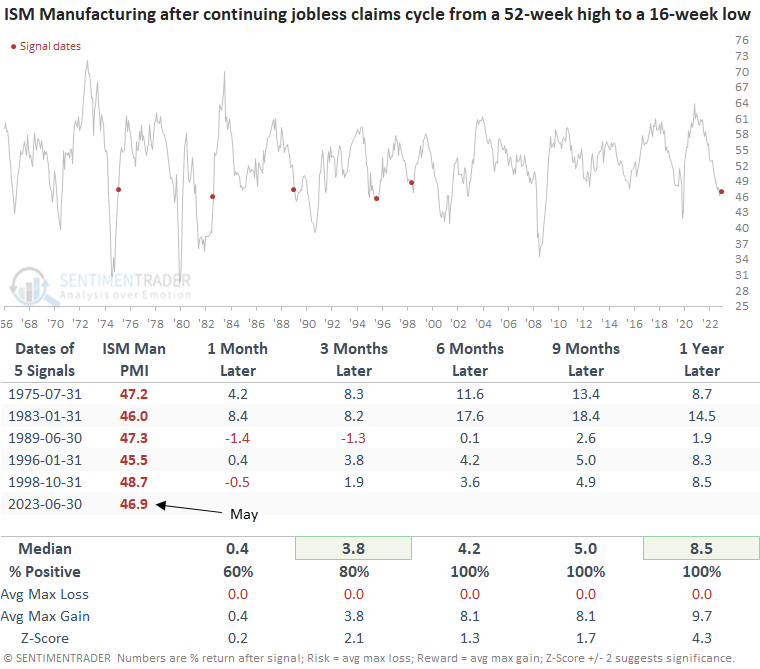
Could the manufacturing sector be close to a turning point?

In cases where the continuing claims reverse with the ISM Manufacturing PMI in contraction territory, the manufacturing survey has increased every time in the subsequent six, nine, and twelve-month periods.

What the research tells us...

Whether housing or now continuing claims, the economy remains resilient in the face of a sharp increase in interest rates. The latest data to show improvement, continuing claims, cycled from a 52-week high to a 16-week low, triggering a bullish signal for stocks, especially cyclically-oriented groups. The improvement in employment tends to lift manufacturing, especially when the ISM survey was in contraction territory.

PRODUCTS
SentimenTrader
Trading Tools
Indicators & Data API
‍
Strategies & Scanner
‍
Research Reports
FREE
RESOUrCES
Simple Backtest
Calculator
Simple Seasonality
Calculator
The Kelly Criterion
Calculator
Sentiment Geo Map
‍
Public Research Reports
‍
Education
Sentiment Indicators
‍
Technical Indicators
‍
Pricing
Bundle pricing
‍
FAQ
‍
Announcements
‍
COMPANY
‍
About
‍
In the News
‍
Testimonials
‍
Client Success Stories
CONTACT
‍
General Inquiries
‍
Media Inquiries
‍
Financial Professionals Inquiries
‍
© 2026 Sundial Capital Research Inc. All rights reserved.
Setsail Marketing
TermsPrivacyAffiliate Program
Risk Disclosure: The information and tools provided are for research and analytical purposes only and are not intended as investment advice. Market analysis involves uncertainty, and outcomes may differ from expectations. Users should conduct their own due diligence and consider their individual circumstances before making any financial decisions. Past performance is not necessarily indicative of future results.

Hypothetical Performance Disclosure: Hypothetical performance results have many inherent limitations, some of which are described below. No representation is being made that any account will or is likely to achieve profits or losses similar to those shown; in fact, there are frequently sharp differences between hypothetical performance results and the actual results subsequently achieved by any particular trading program. One of the limitations of hypothetical performance results is that they are generally prepared with the benefit of hindsight. In addition, hypothetical trading does not involve financial risk, and no hypothetical trading record can completely account for the impact of financial risk of actual trading. for example, the ability to withstand losses or to adhere to a particular trading program in spite of trading losses are material points which can also adversely affect actual trading results. There are numerous other factors related to the markets in general or to the implementation of any specific trading program which cannot be fully accounted for in the preparation of hypothetical performance results and all which can adversely affect trading results.

Testimonial Disclosure: Testimonials appearing on this website may not be representative of other clients or customers and is not a guarantee of future performance or success.