Products
SentimenTrader Trading Tools
‍
Backtest Engine
My Trading Toolkit
Correlation Analysis
Seasonality
Indicators & Data API
‍
Proprietary Indicators & Charts
Market Data API
Strategies & Scanner
‍
50+ Trading Strategies
Smart Stock Scanner
Research Reports
‍
Research Solutions
Reports Library
Free Resources
Simple Backtest Calculator
Simple Seasonality Calculator
The Kelly Criterion Calculator
Sentiment Geo Map
Public Research Reports
Education
Sentiment Indicators
Technical Indicators
Pricing
Company
About
In the News
Testimonials
Client Success Stories
Contact
Log inLoginSign up
< BACK TO ALL REPORTS

Jobless Claims Hit 52-Week High As High Beta Shows Relative Struggles

Jason Goepfert
2019-02-15
null

Climbing claims

A 4-week average of jobless claims hit a 52-week high this week, triggering an increase in the probability of recession.

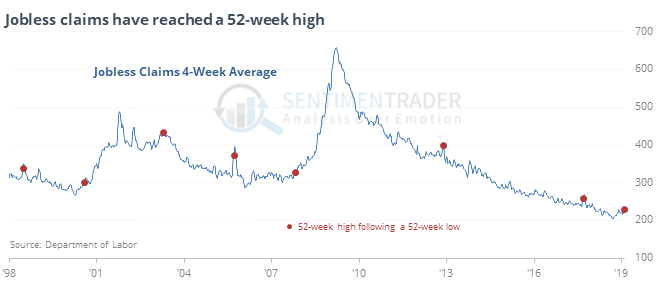
Other times that claims cycled from a 52-week low to a 52-week high since 1967, there was a headwind for stocks and tailwind for bonds, especially over the next couple of months.

A tale of two markets

Low volatility stocks within the S&P 500 have completely erased their December decline and are trading at a 52-week high. High beta stocks, however, suffered a decline about three times as large and are still trading 10% below their high. That has been a short-term headwind for stocks in general.

For these “safer” stocks, outperforming High Beta so much tended to be a good sign. From the next month forward, the return on Low Volatility was above random, significantly so after three months.

More extreme

The McClellan Oscillator for the Shanghai Composite has now jumped above 90. According to the Backtest Engine, since 2003 there have been 10 other days when its breadth momentum hit this high of a level, leading to losses over the next 1 and 8 weeks.

More momentum

We’ve looked at the thrust in breadth many times over the past month and a half, including earlier this week. It remains the most positive development of anything we look at. For the record, the NYSE McClellan Summation Index just crossed 1,000 for the first time in at least 50 days. Per the Backtest Engine, that led to a positive return for the S&P 500 over the next year 27 out of 28 times.

This post was an abridged version of our previous day's Daily Report. For full access, sign up for a 30-day free trial now.

PRODUCTS
SentimenTrader
Trading Tools
Indicators & Data API
‍
Strategies & Scanner
‍
Research Reports
FREE
RESOUrCES
Simple Backtest
Calculator
Simple Seasonality
Calculator
The Kelly Criterion
Calculator
Sentiment Geo Map
‍
Public Research Reports
‍
Education
Sentiment Indicators
‍
Technical Indicators
‍
Pricing
Bundle pricing
‍
FAQ
‍
Announcements
‍
COMPANY
‍
About
‍
In the News
‍
Testimonials
‍
Client Success Stories
CONTACT
‍
General Inquiries
‍
Media Inquiries
‍
Financial Professionals Inquiries
‍
© 2026 Sundial Capital Research Inc. All rights reserved.
Setsail Marketing
TermsPrivacyAffiliate Program
Risk Disclosure: Futures and forex trading contains substantial risk and is not for every investor. An investor could potentially lose all or more than the initial investment. Risk capital is money that can be lost without jeopardizing ones’ financial security or life style. Only risk capital should be used for trading and only those with sufficient risk capital should consider trading. Past performance is not necessarily indicative of future results.

Hypothetical Performance Disclosure: Hypothetical performance results have many inherent limitations, some of which are described below. No representation is being made that any account will or is likely to achieve profits or losses similar to those shown; in fact, there are frequently sharp differences between hypothetical performance results and the actual results subsequently achieved by any particular trading program. One of the limitations of hypothetical performance results is that they are generally prepared with the benefit of hindsight. In addition, hypothetical trading does not involve financial risk, and no hypothetical trading record can completely account for the impact of financial risk of actual trading. for example, the ability to withstand losses or to adhere to a particular trading program in spite of trading losses are material points which can also adversely affect actual trading results. There are numerous other factors related to the markets in general or to the implementation of any specific trading program which cannot be fully accounted for in the preparation of hypothetical performance results and all which can adversely affect trading results.

Testimonial Disclosure: Testimonials appearing on this website may not be representative of other clients or customers and is not a guarantee of future performance or success.