Products
SentimenTrader Trading Tools
‍
Backtest Engine
My Trading Toolkit
Correlation Analysis
Seasonality
Market Prediction
Indicators & Data API
‍
Proprietary Indicators & Charts
Market Data API
Strategies & Scanner
‍
50+ Trading Strategies
Smart Stock Scanner
Smart Option Scanner
Research Reports
‍
Research Solutions
Reports Library
Free Resources
Simple Backtest Calculator
Simple Seasonality Calculator
The Kelly Criterion Calculator
Sentiment Geo Map
Public Research Reports
Education
Sentiment Indicators
Technical Indicators
Pricing
Company
About
In the News
Testimonials
Client Success Stories
Contact
Log inLoginSign up
< BACK TO ALL REPORTS

It's time to take a different look at technology

Jay Kaeppel
2022-10-12
The technology sector has lost roughly a third of its value since peaking in 2021. Many are now convinced that further losses are imminent. But before throwing in the towel, there are a few factors to consider.

Key points:

  • The technology sector appears to be on the precipice of a further decline
  • However, it is also entering the most favorable seasonal period of the year
  • Likewise, several other typically reliable indicators suggest a possible bullish surprise

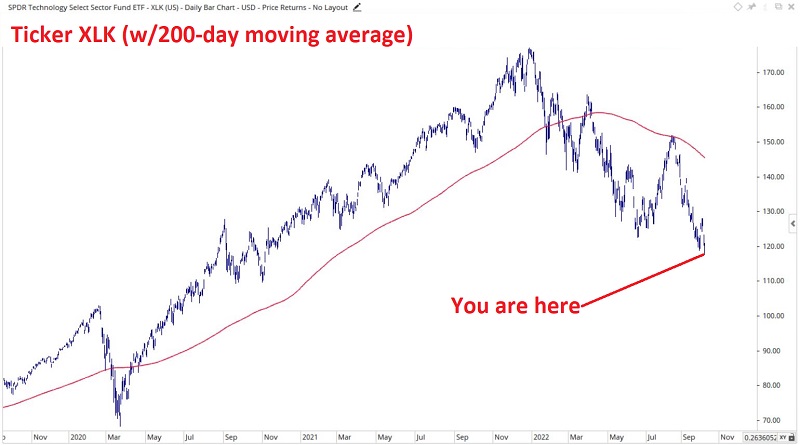
The current price trend is bearish

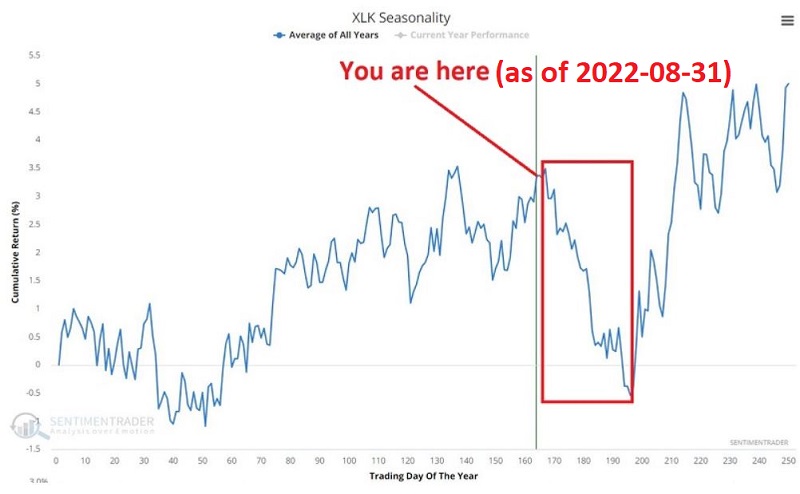
There can be little argument that the current price trend for technology is unfavorable. This does not come as a surprise, as discussed in this piece on 2022-08-31. The chart below is from that article and highlights a seasonally weak period from 2022-08-31 through 2022-10-12.

This one played out according to the script, as seen in the chart below.

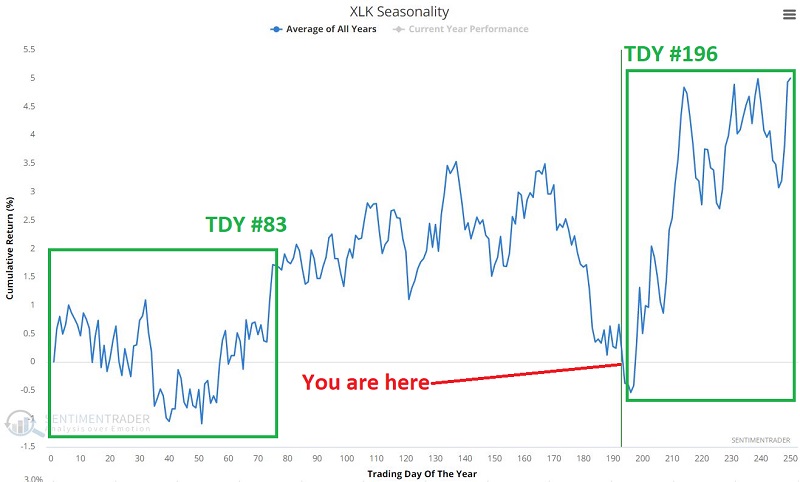
But unfavorable seasonal periods do not last forever.

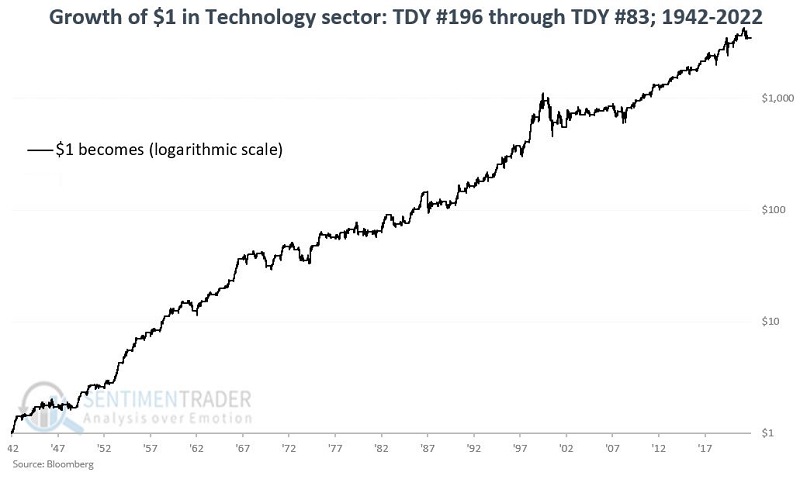
The chart below displays the annual seasonal trend for XLK and highlights a favorable period that extends from Trading Day of Year (TDY) #196 through TDY #83 the following year.

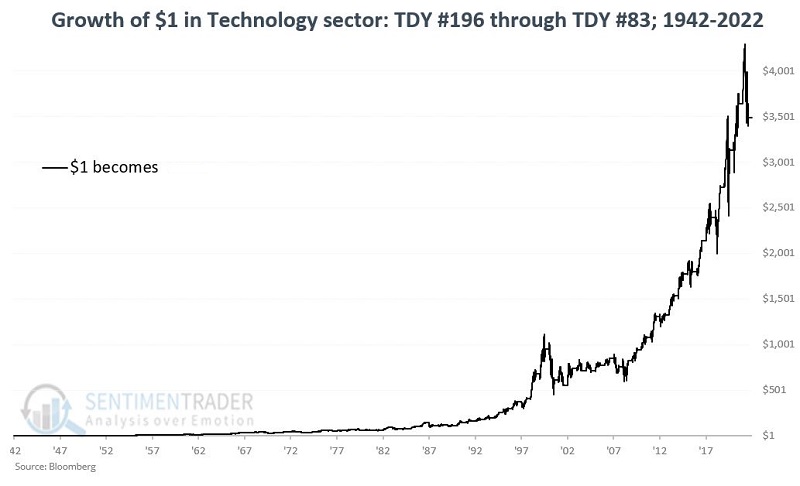
The chart below displays the cumulative growth of $1 invested in the technology sector only from TDY #196 through TDY #83 every year since 1942. Note: The dataset uses the Fama French indexes from 1942 into 1991 and the S&P 500 Technology Sector Index from there.

The chart below displays the same data as the chart above but on a logarithmic scale. 

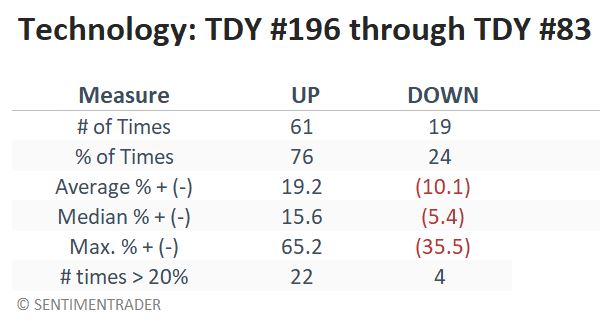
The table below summarizes the results for this period.

This seasonal period offers no guarantees on a year-by-year basis, but the long-term bias is favorable. Let's consider some other key indicators giving recent signals to bolster the favorable seasonal outlook.

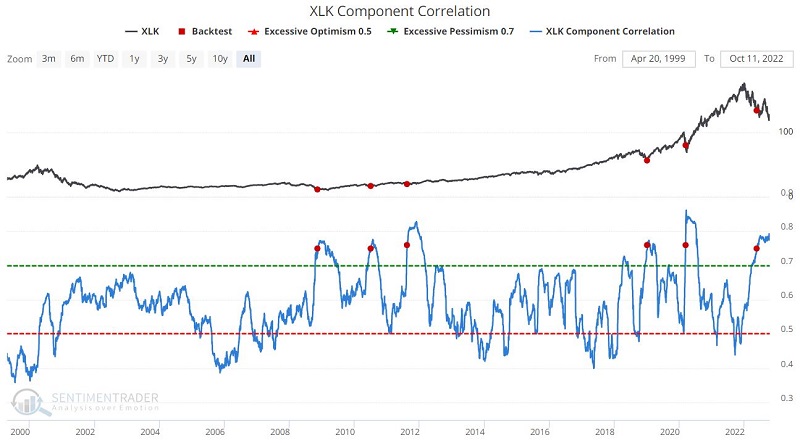
Component correlation is extremely high

The component correlation measures the degree to which the stocks in a given sector or index trend together. High correlation tends to occur near bottoms, as investors indiscriminately dump stocks in that sector.

The chart below displays those times when the XLK Component Correlation crossed above 0.75 for the first time in six months, and the table summarizes XLK results following previous signals. The most recent signal occurred on 2022-05-23.

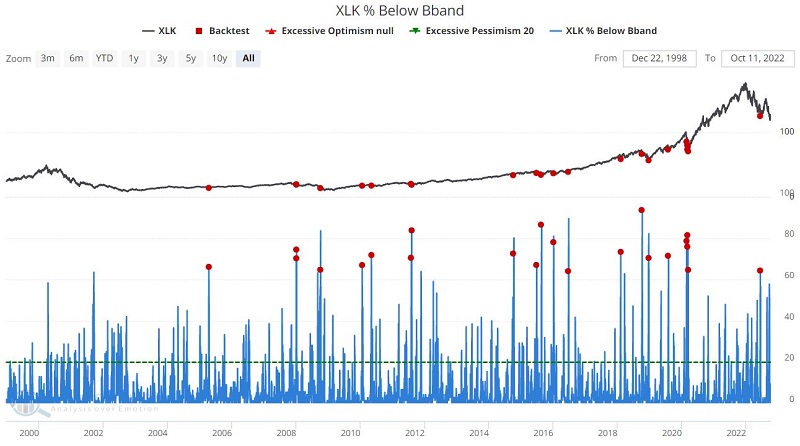
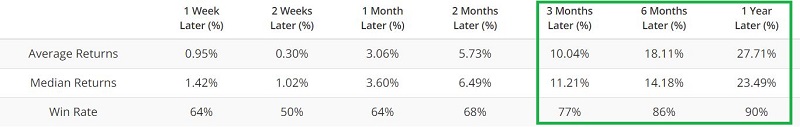
The majority of XLK stocks dropped below their Bollinger Bands

The chart and table below display those times when the percentage of XLK constituent stocks below their lower Bollinger Band crossed above 64 and a summary of the results. This reading indicates a high degree of selling pressure in the sector and is typically bullish on a contrarian basis. The most recent signal occurred on 2022-06-13.

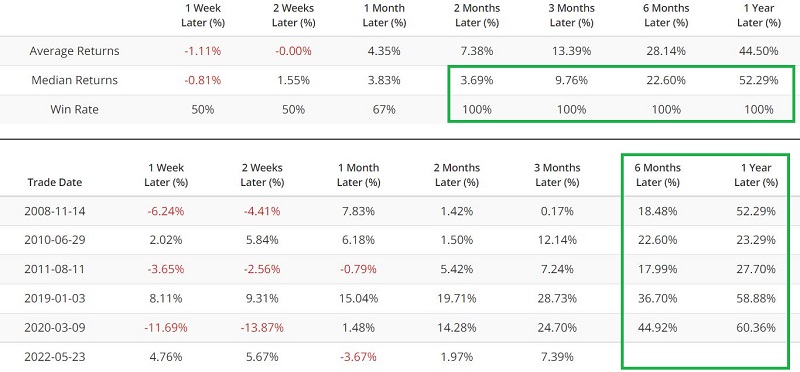
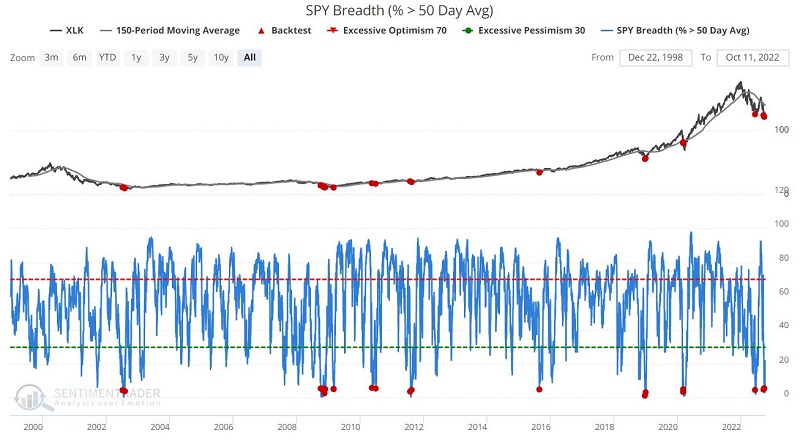
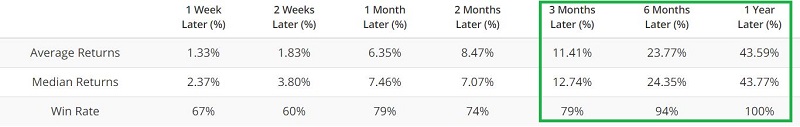
Tech rallies tend to follow SPX breadth washouts

The chart below displays those days when the % of SPX 500 constituent stocks above their 50-day moving average was below 6% while the S&P 500 Index was below its 150-day moving average. The table displays a summary of the results. The most recent signal occurred on 2022-09-29.

What the research tells us…

On a trend-following basis, it makes sense to be patient and wait for the tech sector to show signs of life before taking the plunge into this often lucrative but always volatile sector. Nevertheless, we appear to be reaching a point where investors are beginning to give up on the technology sector. This action, combined with the beginning of a reliably bullish seasonal period, offers the potential to leave investors quite surprised in the months ahead.

PRODUCTS
SentimenTrader
Trading Tools
Indicators & Data API
‍
Strategies & Scanner
‍
Research Reports
FREE
RESOUrCES
Simple Backtest
Calculator
Simple Seasonality
Calculator
The Kelly Criterion
Calculator
Sentiment Geo Map
‍
Public Research Reports
‍
Education
Sentiment Indicators
‍
Technical Indicators
‍
Pricing
Bundle pricing
‍
FAQ
‍
Announcements
‍
COMPANY
‍
About
‍
In the News
‍
Testimonials
‍
Client Success Stories
CONTACT
‍
General Inquiries
‍
Media Inquiries
‍
Financial Professionals Inquiries
‍
© 2026 Sundial Capital Research Inc. All rights reserved.
Setsail Marketing
TermsPrivacyAffiliate Program
Risk Disclosure: The information and tools provided are for research and analytical purposes only and are not intended as investment advice. Market analysis involves uncertainty, and outcomes may differ from expectations. Users should conduct their own due diligence and consider their individual circumstances before making any financial decisions. Past performance is not necessarily indicative of future results.

Hypothetical Performance Disclosure: Hypothetical performance results have many inherent limitations, some of which are described below. No representation is being made that any account will or is likely to achieve profits or losses similar to those shown; in fact, there are frequently sharp differences between hypothetical performance results and the actual results subsequently achieved by any particular trading program. One of the limitations of hypothetical performance results is that they are generally prepared with the benefit of hindsight. In addition, hypothetical trading does not involve financial risk, and no hypothetical trading record can completely account for the impact of financial risk of actual trading. for example, the ability to withstand losses or to adhere to a particular trading program in spite of trading losses are material points which can also adversely affect actual trading results. There are numerous other factors related to the markets in general or to the implementation of any specific trading program which cannot be fully accounted for in the preparation of hypothetical performance results and all which can adversely affect trading results.

Testimonial Disclosure: Testimonials appearing on this website may not be representative of other clients or customers and is not a guarantee of future performance or success.