
It's time to put commodities back on the radar - Part II

Key points
- In Part I, we highlighted a 30-year cycle that typically sees commodities significantly outperform stocks during the first 15 years and vice versa during the last 15 years
- A new 30-year cycle begins at the end of June 2023
- In Part II, we will take a closer look at commodity and stock performance during the first 15 years of previous cycles
First 15 years of the 30-year cycle
As a quick refresher, to measure commodity returns, we use the month-end prices for the following indexes:
- For commodities, we use the Bloomberg futures index from 1933 to1960 and the Bloomberg Spot Commodity Index from 1960 to the present
- For stocks, we use the monthly closing price for the S&P 500 Index
In Part I, we included the table below, which displays commodity and stock market performance during the first 15 years of each 30-year cycle since 1933. A new 30-year cycle begins at the close on 2023-06-30.
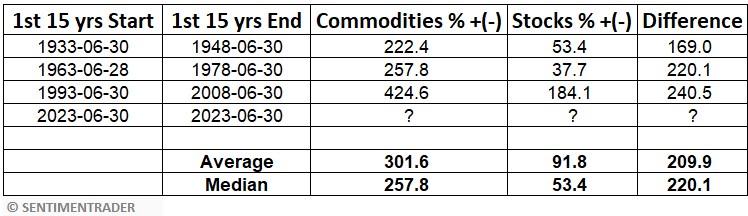
The critical thing to note in the table above is that during the first 15 years of previous 30-year cycles, commodities outperformed stocks by better than 3-to-1 on average (the difference is almost 5-to-1 if using median returns instead of average returns).
Commodity performance during the first 15 years
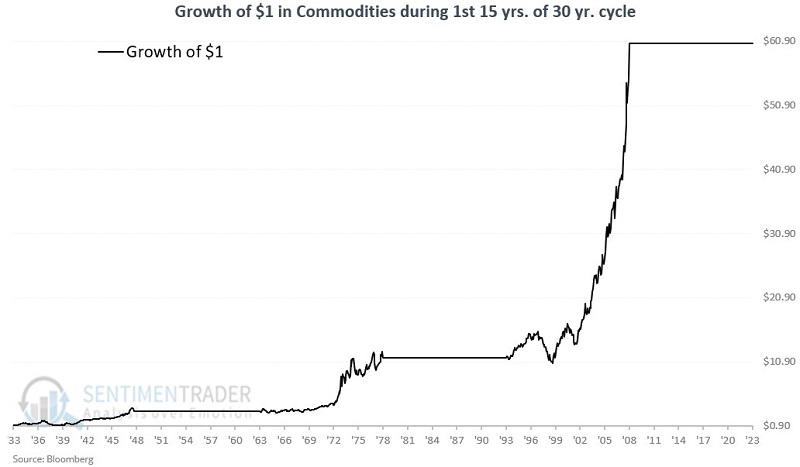
The chart below displays the growth of $1 in commodities (using the Bloomberg indexes as a proxy) only during the first 15 years of each previous 30-year cycle.
To get a different perspective, the chart below displays the same results as above on a logarithmic scale (i.e., the distance between 1 and 10 is the same as the distance between 10 and 100).
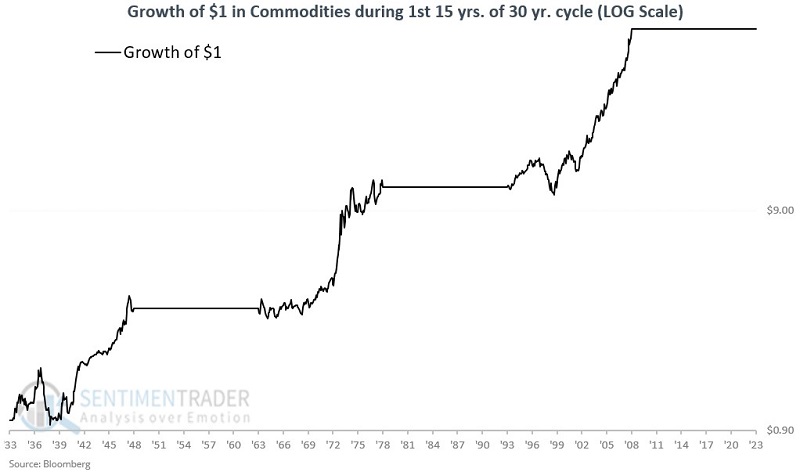
A closer look at the charts above reveal that:
- There is no guarantee that commodities will enjoy "smooth sailing" just because the calendar falls within a particular time period
- Nevertheless, the long-term "lower left to upper right" nature of returns is unmistakable - and when commodities "go," they really "go."
Stock performance during the first 15 years
The chart below displays the growth of $1 in stocks (using the S&P 500 Index as a proxy) only during the first 15 years of each previous 30-year cycle.
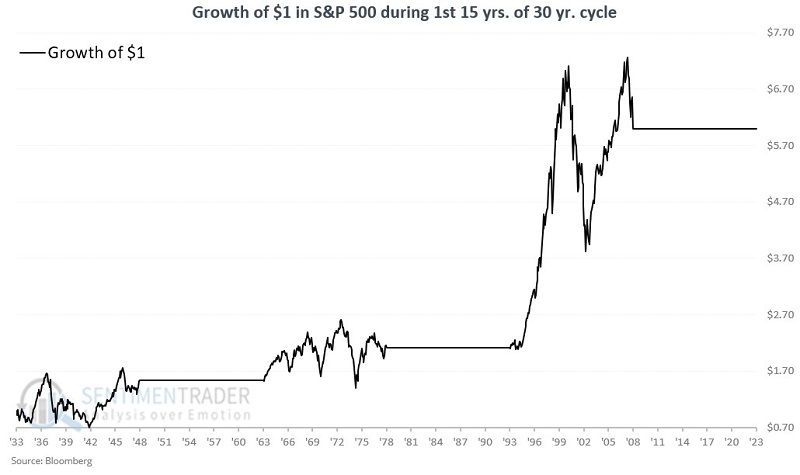
The beauty of investing in the stock market is that it tends to rise over long periods of time. In the past 40 years, investors have gotten used to decent stock market returns. Nevertheless, the returns during the first 15 years of each previous 30-year cycle have been historically subpar.
- From June 1933 to June 1948, the compounded rate of return was +2.9%
- From June 1963 to June 1978, the compounded rate of return was +2.2%
- From June 2008 to June 2023, the compounded rate of return was +7.2%
A closer look at the chart above reveals a great deal of volatility, some significant market declines, and a lot of choppy, sideways action.
Comparing commodities to stocks during the first 15 years
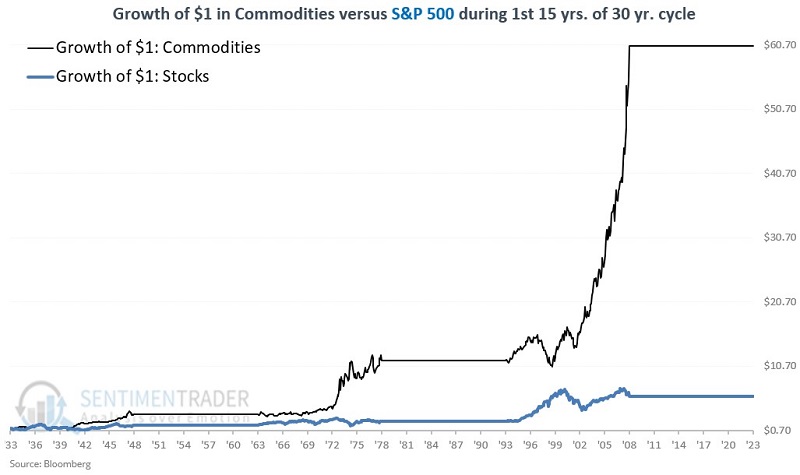
The chart below displays the growth of $1 in commodities (black line) versus $1 in stocks (blue line) if held only during the first 15 years of each previous 30-year cycle.
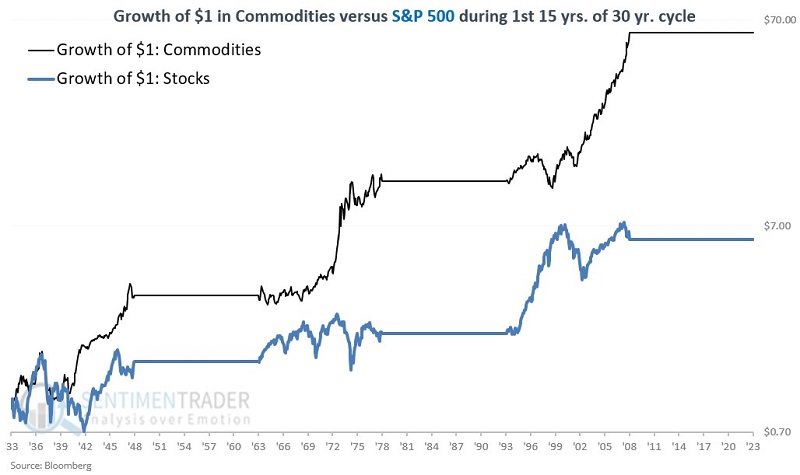
The chart below displays the same data as the chart above on a logarithmic scale.
 What the research tells us…
While historical results have been fairly consistent, the implication of the information above is NOT that everyone should sell all their stocks and put everything into commodities for the next fifteen years on July 1st. No one should assume that come July 1st commodities will enjoy uninterrupted smooth sailing for the next 15 years while the stock market will fall apart.
The real purpose of this series remains to open traders' and investors' minds to potential opportunities. If history proves an accurate guide, individuals who gain exposure to commodities as an asset class during the next fifteen years may vastly outperform those who stick exclusively to stocks.