
Its time to pay close attention to inflation expectations

Key points
- Investor surveys typically act as contrary indicators; One exception to the rule appears to be the University of Michigan Inflation Expectation index
- Recent high readings in this index seem to suggest a risk of higher inflation in the year ahead; A decline in expectations in the months ahead would be a welcome sign
- The data below examines the index's history and potential implications for inflation and the stock market
University of Michigan Inflation Expectations
As the name implies, the University of Michigan Inflation Expectation index (UMIE) tracks a survey of investors' expectations for the rate of change in inflation in the year ahead. The chart below shows that the most recent reading was for March 2025, which was reported on April 25, 2025. According to that survey, investors at that time were expecting inflation to rise 5.0% in the year ahead.
Please note that the next updated UMIE value is reported on 2025-05-30 and can be found here.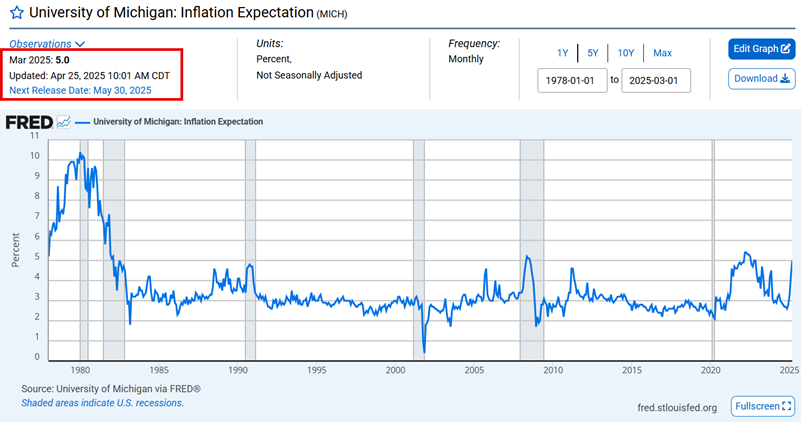
Typically, we find that survey extremes tend to work as contrary indicators. However, our research reveals that this may be an exception to that rule. To wit: The probability of elevated CPI inflation in the next 12 months appears to be higher if the University of Michigan Inflation Expectation (UMIE) is 4.6% or higher. Let's take a closer look.
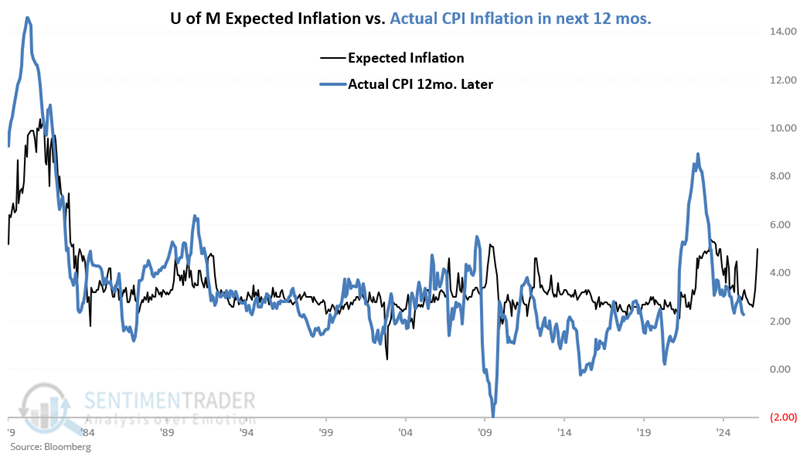
In the chart below, we see the history of UMIE versus actual 12-month CPI inflation:
- Black Line (A) = the UMIE at the end of each month starting in 1978
- Blue Line (B) = the actual 12-month change in CPI over the next 12 months
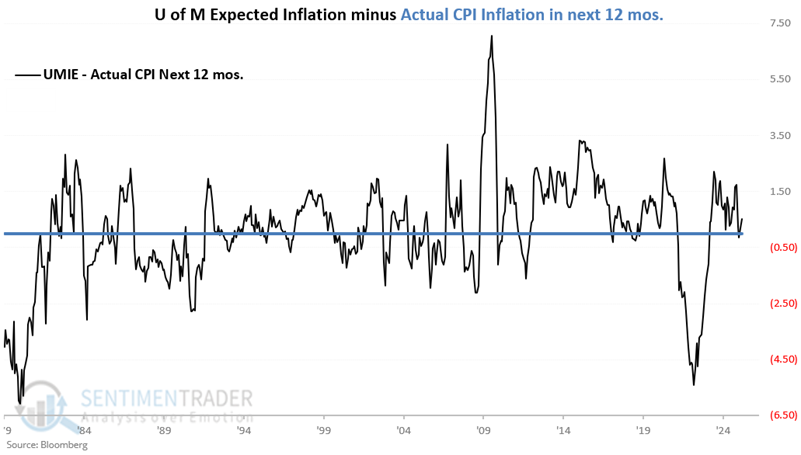
The chart below shows A - B.
The correlation coefficient is 0.77, so the two have a significant correlation. But how useful is this information?
While surveys of "expectations" are often seen as contrary indicators, a closer look at the data reveals that higher expected inflation is more often followed by above-average inflation and vice versa.
After some analysis, we arbitrarily set the line of demarcation between lower and higher expectations as 4.6% for the Michigan survey. While the data for each month is available before the month-end, we analyze the data only at the end of each month.
Note that the median 12-month change for the Consumer Price Index for all months during the test period starting in 1978 (the earliest date of UMIE data) is 2.85%. More subjectively, inflation above 3% is considered somewhat worrisome, inflation above 4% is typically a negative for stocks and/or the economy, and anything above our arbitrary cutoff of 4.6% is considered "very high" inflation.
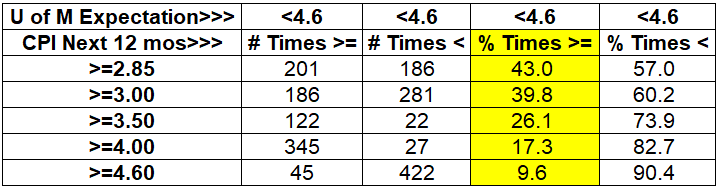
The table below summarizes CPI performance following UMIE month-end readings of 4.6% or higher.
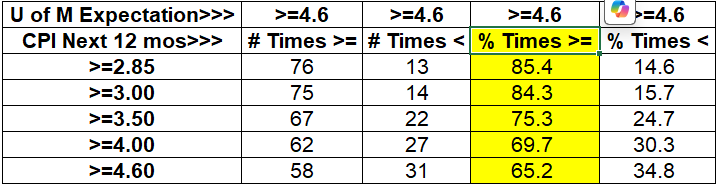
There have been 89 months that ended with the UMIE projecting inflation of 4.6% or higher over the next 12 months
- 85.4% of the time, CPI inflation in the next year was above average (i.e., > 2.85%); 14.6% of the time, CPI inflation was below average
- 84.3% of the time, CPI inflation in the next year was 3% or higher; 15.7% of the time, CPI inflation was below 3%
- 75.3% of the time, CPI inflation in the next year was 3.5% or higher; 15.7% of the time, CPI inflation was below 3.5%
- 69.7% of the time, CPI inflation in the next year was 4% or higher; 15.7% of the time, CPI inflation was below 4%
- 65.2% of the time, CPI inflation in the next year was 4.6% or higher; 15.7% of the time, CPI inflation was below 4.6%
The bottom line is that higher inflationary expectations have, in fact, witnessed above-average inflation in the year ahead far more often than not.
It should be noted that these are historical results, and there is no guarantee that things will be the same in the future. That said, based on this historical data, the current UMIE of 5.0% suggests that we should be wary of a resurgence of inflation in the year ahead. Also, please remember to check this number after the April 2025 UMIE value is reported on 2025-05-30.
Inflation after lower expectations
To complete the research, let's review CPI performance in the year after lower UMIE readings. So, let's look at all months when UMIE ended below 4.6%.
The table below summarizes CPI performance following UMIE month-end readings below 4.6%.
467 months ended with the UMIE projecting inflation of less than 4.6% over the next 12 months.
- 43.0% of the time, CPI inflation in the next year was above average (i.e., > 2.85%); 57.0% of the time, CPI inflation was below average
- 39.8% of the time, CPI inflation in the next year was 3% or higher; 60.2% of the time, CPI inflation was below 3%
- 26.1% of the time, CPI inflation in the next year was 3.5% or higher; 73.9% of the time, CPI inflation was below 3.5%
- 17.3% of the time, CPI inflation in the next year was 4% or higher; 82.7% of the time, CPI inflation was below 4%
- 9.6% of the time, CPI inflation in the next year was 4.6% or higher; 90.4% of the time, CPI inflation was below 4.6%
Clearly, when UMIE has been below 4.6%, the odds have favored more moderate (and far fewer extremes in) inflation.
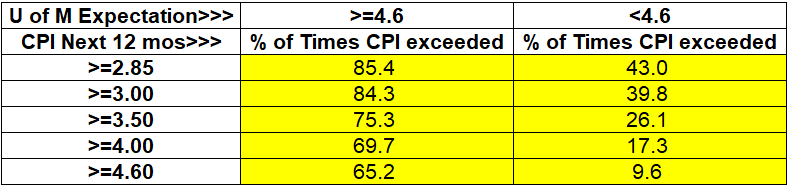
Summarizing UMIE as a predictor of future inflation
The table below combines the results from the tables above by showing the % of times CPI inflation in the next 12 months exceeded a given level, depending on whether the month-end UMIE was above or below 4.6%.
UMIE as a stock market indicator
Can the UMIE be used as a stock market indicator? Let's consider that question. Our research suggests that UMIE readings of 3.3% or lower are a favorable sign for stock prices in the year ahead. On the other hand, readings above 3.3% have tended to be less meaningful as a predictor of future stock market movement. Let's take a closer look.
The chart below displays the hypothetical growth of $1 in the S&P 500 index only during those months when the UMIE ended the previous month at or below 3.30% since 1978. The cumulative growth was +3,359.2%.
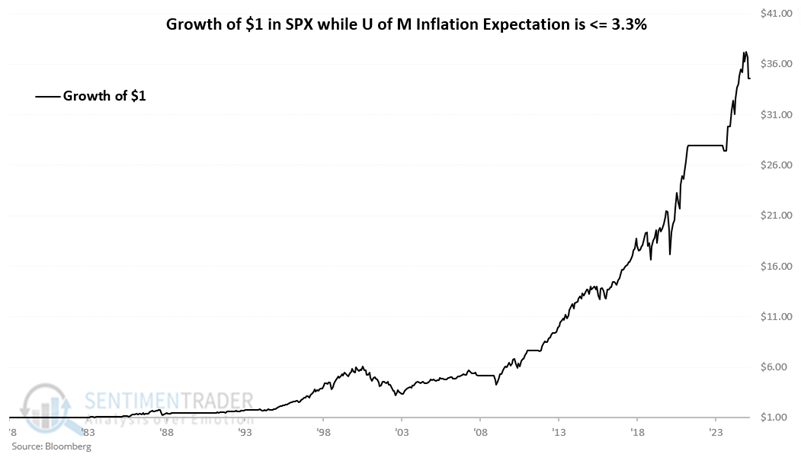
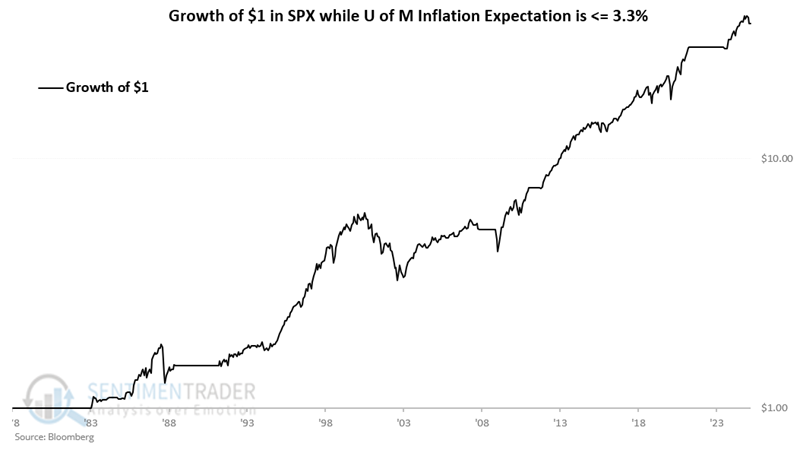
The chart below displays the same results on a logarithmic scale.
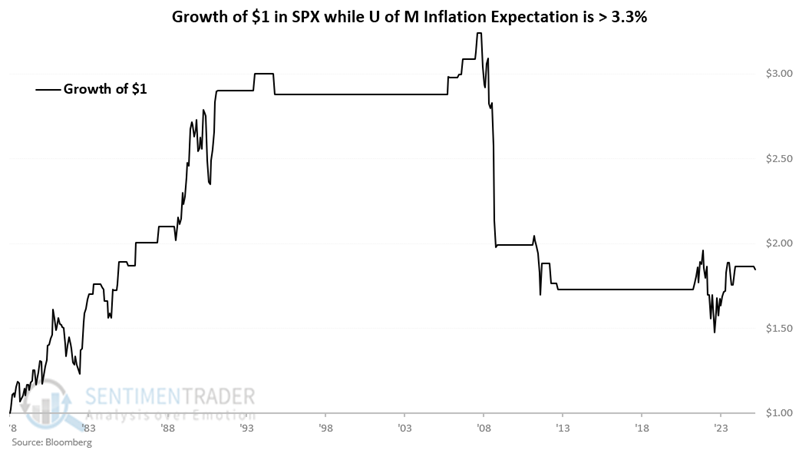
Conversely, the chart below displays the hypothetical growth of $1 in the S&P 500 index only during those months when the UMIE ended the previous month above 3.30% since 1978. The cumulative growth was +85.0%. Note that the stock market mostly ignored inflationary concerns during the bull run in the 1980s and 1990s (inflation at that time was down significantly from the double-digit spikes in the late 1970s and early 1980s), but struggled during bouts of inflation in 2007-08, 2011-12, and in 2022.
The table below summarizes monthly S&P 500 performance depending on whether the previous month showed a UMIE of less than/equal to 3.3% or more than 3.3%.
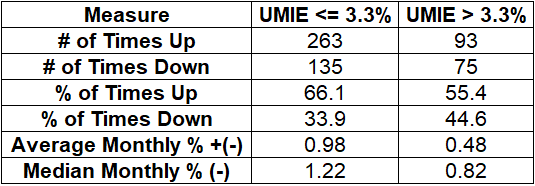
The key point to note in the table above is that the S&P 500 results for each measure were better when UMIE was 3.3% or lower.
What the research tells us…
The most recent reading was an uncomfortable 5.0%. Is this a reason to panic and sell? Or to load up on inflation hedges? Not necessarily. A new report is coming out in a matter of days. But the data above does suggest that concerns of high inflation can be, um, a concern.
Can we use the information above for trading purposes? That's for each trader to decide. This study is more about ignoring "predictions" regarding inflation and objectively setting (or adjusting, as the case may be) one's expectations regarding inflation. As such, UMIE readings of 4.6% or above suggest a meaningfully higher probability of above-average inflation in the year ahead.
As a stock market indicator, UMIE is best used as a weight of the evidence and not as a trading system. Readings of 3.3% or lower can be viewed as favorable weight of the evidence. Readings above 3.3% suggest a higher potential for trouble for stocks, but they should likely be considered relatively meaningless in terms of forecasting stock market direction.