
It's time to keep an eye on utilities

Key points
- Seasonality is posing a slight headwind for the broader market, but a slight tailwind for the utility sector
- Utility sector insiders recently engaged in a round of significant accumulation
- The sector recently - and quietly - completed a washout in terms of stocks making new highs
- Interest rate-related sentiment recently flashed a historically favorable signal for utilities
Utilities are sometimes a port in the seasonal storm
The chart below displays the annual seasonal trend for the S&P 500 Index.
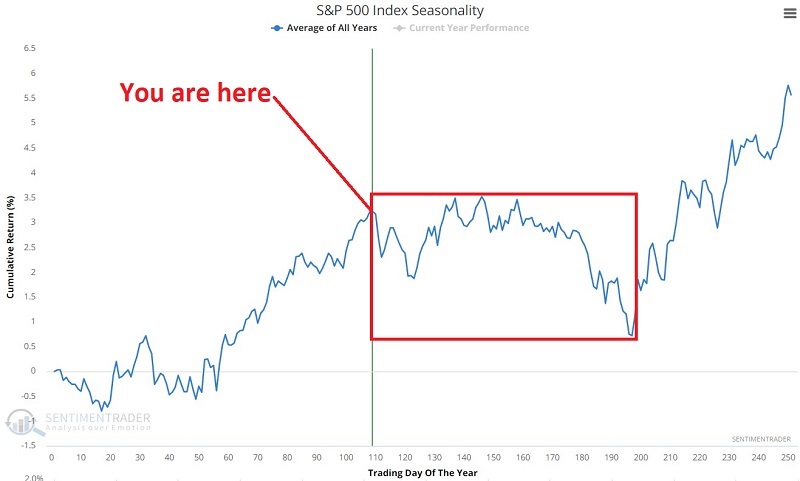
Note that we are ostensibly entering a period that has shown a tendency to see the overall market move sideways to lower. It is important to note that results can vary substantially from year to year and that this chart is a summary of previous tendencies and not a roadmap.
With all that in mind, the chart displays the annual seasonal trend for the Utilities Select Sector SPDR fund (XLU).

While results can vary significantly from year to year (and utilities can suffer significant declines from time to time), the key thing to note is that during the same timeframe marked above for SPX, XLU has performed significantly better than the overall market.
The chart below displays the growth of $1 in the S&P 500 Utility sector index and the S&P 500 Index (using total return data) if held only from the close on Trading Day of the Year (TDY) #109 through TDY #197 every year since 1988.
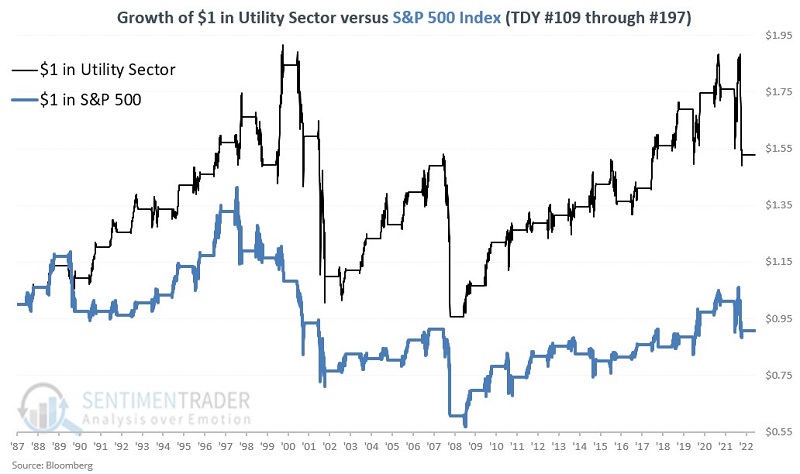
The utility sector showed a cumulative gain of +52.9%, while the S&P 500 Index showed a net loss of -9.3%. These results tell us nothing about what will happen in the months ahead in 2023. But they suggest a slight seasonal tailwind for utilities and a slight seasonal headwind for the broader stock market.
Now let's look at some more utilities-centric indicators.
Insiders recently accumulating shares
It is generally acknowledged that corporate insiders know more about the prospects for their own companies than anyone else. When insiders within a given sector start accumulating shares meaningfully, it signals that they expect better days ahead. There are two things to note about insider buying in general:
- They are often early (heavy buying does not mean an instantaneous rally)
- They are rarely terribly wrong over a 1-3 year time period
As discussed in this article, utility insiders recently engaged in a rare period of heavy accumulation. The red dots in the chart below highlight all weeks when the 10-week average of our Corporate Insider Buy/Sell Ratio - XLU was above 0.45. The most recent cluster of signals lasted from late February through early May.
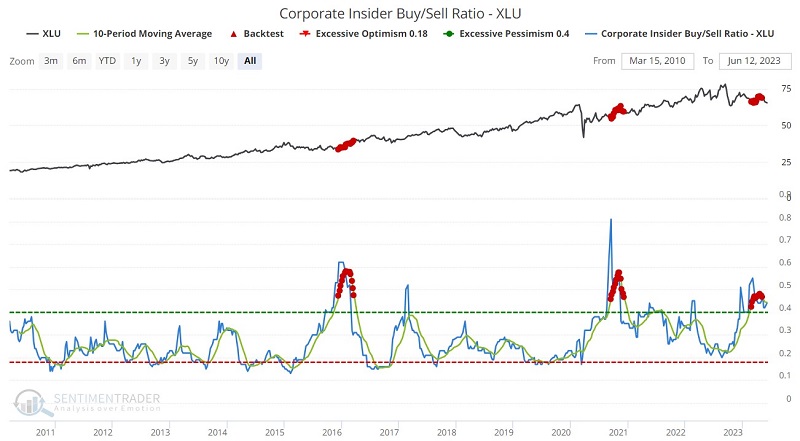
Because the sample size of previous instances is so tiny, it is a mistake to assume that utility stocks are sure to rally in the year ahead. Still, the primary point is that utility sector insiders have positioned themselves bullishly. History suggests that good things will follow in the twelve to 36 months ahead.
The utility sector experienced a washout under the radar
Another reason to look optimistically at the utility sector is that it appears to have recently completed a bearish cycle in terms of breadth. Previous instances have tended to be followed by above-average results.
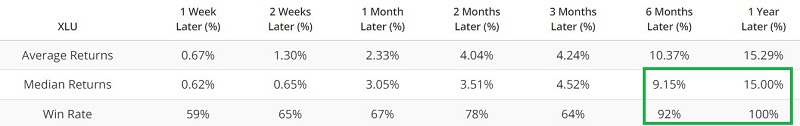
Our XLU New High % indicator shows the percentage of stocks in XLU currently trading at a new 52-week high. The red dots in the chart below highlights those dates when the 100-day average for XLU New High % crossed below 0.75%. The table summarizes subsequent XLU performance.
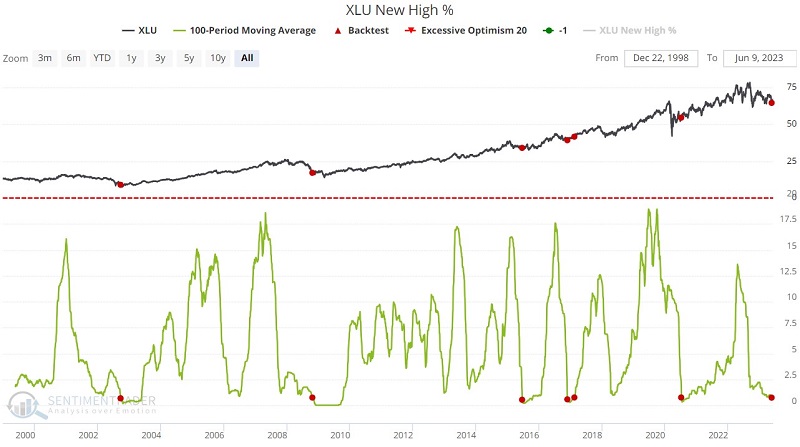
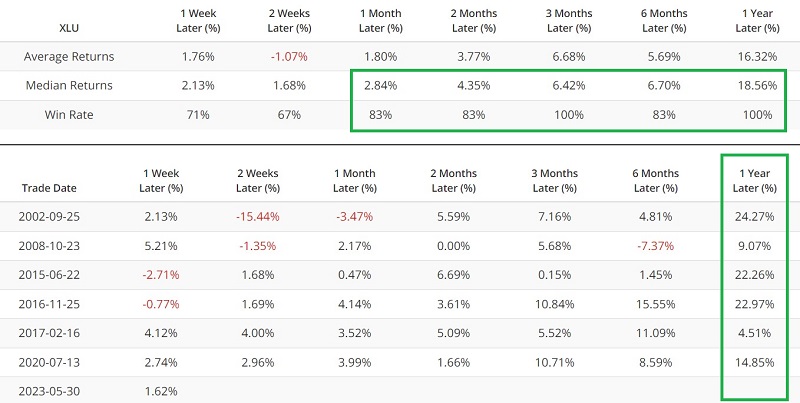
Again, there is no guarantee that the most recent signal on 2023-05-30 will see XLU higher in the weeks and months ahead. But the indicator currently falls squarely on the favorable side of the ledger.
Washout in bond sentiment may be favorable for utilities
Utility stocks are susceptible to changes in interest rates. Some investors even consider utility stocks a stock market proxy for bonds. While this is not entirely accurate, there is a meaningful correlation. As a result, when bond trader sentiment gets overdone to the bearish side, it can be a positive factor for utilities.
We will use a 10-day average of our 10-Yr Optix indicator for this test. The red dots in the chart below highlights those dates when the 10-week average for 10-Yr Optix was below 7.5%. The table summarizes subsequent XLU performance.

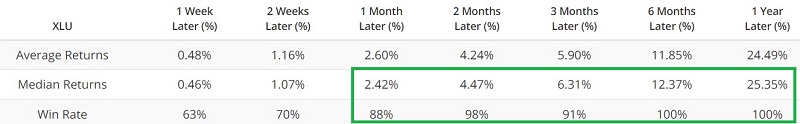
The caveat is that interest rates may be relatively early in a longer-term rising trend. As a result, a bounce back in interest rate-sensitive securities such as bonds and utilities is no sure thing, regardless of how unfavorable bond trader sentiment becomes. Nevertheless, until proven otherwise, the recent signals from this indicator also fall firmly on the favorable side of the ledger.
What the research tells us…
Utilities are rarely an exciting place to invest. But like every other sector, there are times when this stodgy sector can be a relatively good place to be. With favorable recent indications from seasonality, insider activity, breadth, and sentiment, the months ahead could be one of those times.