
It's time to keep an eye on unleaded gas

Key points
- Unleaded gas tends to be a highly cyclical market
- This market is entering a typically favorable seasonal period
- ETF ticker UGA offers an alternative to trading riskier unleaded gas futures
Gasoline is a highly seasonal market
The chart below displays the annual seasonal trend for unleaded gas futures (ticker RB).
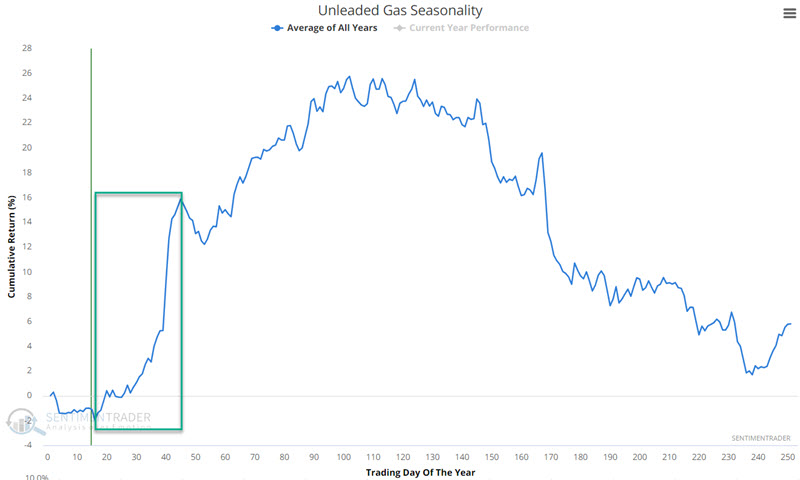
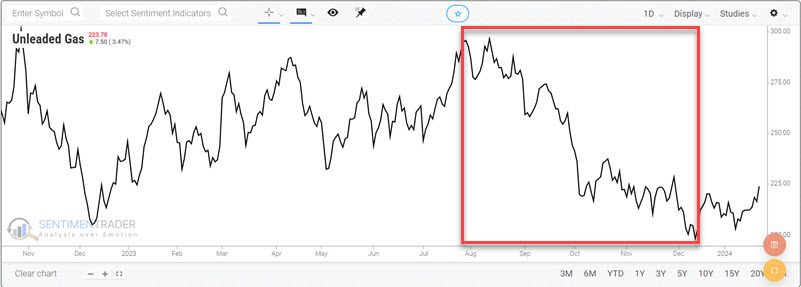
The chart above shows that this market tends to experience significant weakness in the second half of the year. Despite all the dire prognostications regarding gas prices early in 2023, gas futures followed their typical seasonal pattern and fell hard during the year's second half.
The most important thing to note is that unleaded gas is re-entering a typically favorable seasonal period.
Entering a seasonally favorable period
The seasonally favorable period extends from the close of Trading Day of the Year (TDY) #16 through the close of TDY #45. Note that the contract we follow from Bloomberg tracks spot RB and includes all dates when electronic trading takes place (which typically means most weekdays, including most holidays).
For 2024, this period extends from the close on 2024-01-23 through 2023-03-04.
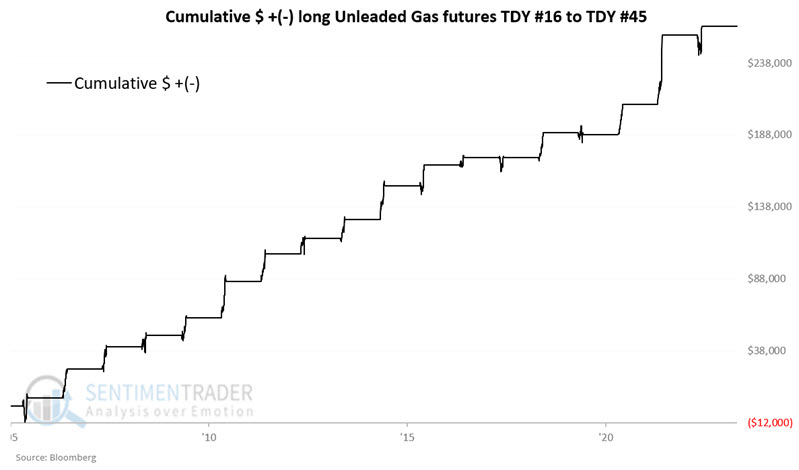
The chart below displays the cumulative hypothetical gain from holding long one unleaded gas futures contract only during TDY #16 through TDY #45, every year since 2005 when the current configuration of RB futures started trading.
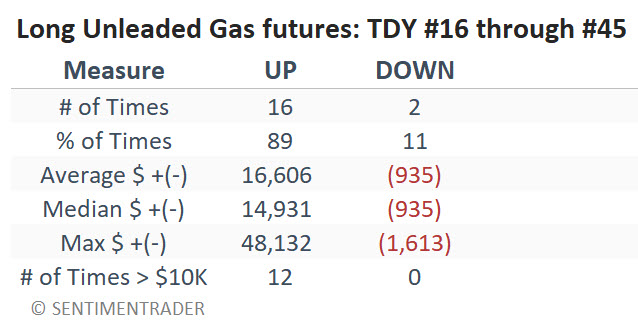
The table below summarizes performance results during this favorable seasonal period.
The good news is that historical results have been consistently favorable. The bad news is that there is no guarantee that future results will be similar. Likewise, the fact remains that unleaded gas futures are inherently very volatile and require very deep pockets (and a solid understanding of the unlimited risk inherent in futures trading) to trade.
To better illustrate the potential risks involved, the chart below displays the drawdowns a trader would have experienced holding a long position in unleaded gas futures from TDY #16 through TDY #45 each year.
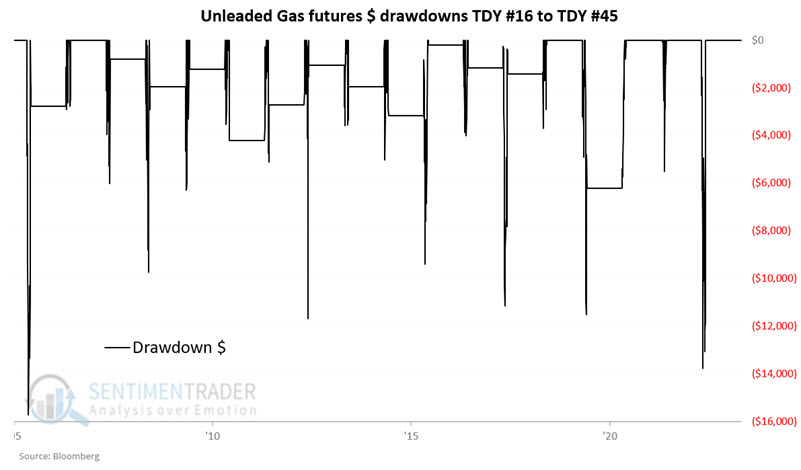
On the plus side, holding unleaded gas futures during this favorable period generated a gain of over $10K in 12 out of 18 years. On the negative side, there have been seven separate interim drawdowns over -$9,000.
Bottom line: The good news is that historical results have been consistently favorable. The bad news is that there is no guarantee that future results will be similar, and a trader must be willing and financially able to ride out sizeable drawdowns to reap the rewards. Deep pockets and a solid understanding of the unlimited risk inherent in futures trading are essential to profit from this seasonal trend in the futures market.
Using an ETF as an alternative
The United States Gasoline Fund® LP (UGA) is an exchange-traded security designed to track the movements of gasoline futures prices in percentage terms. UGA issues shares that may be bought and sold like stock shares. The futures contracts held by ticker UGA are based on its own prescribed roll schedule. This means that the daily percentage fluctuation in UGA may differ from those of the spot contract we used above to track RB futures directly.
NOTE: We use the exact buy and sell dates for UGA that we did for RB futures above to compare apples to apples.
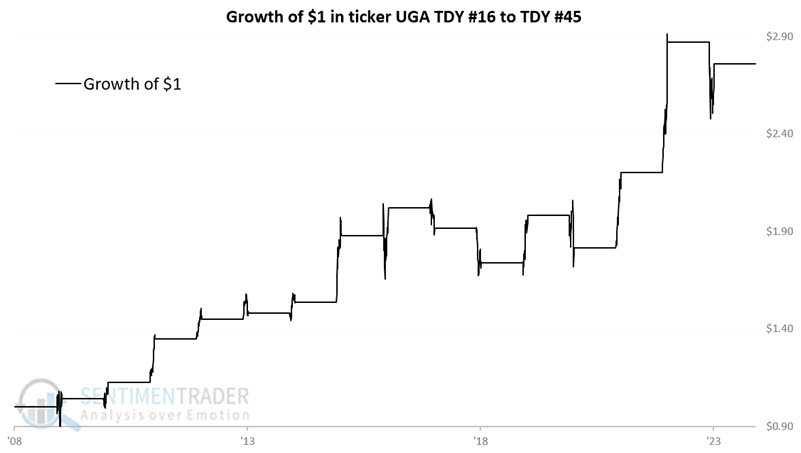
The chart below displays the growth of $1 invested in UGA only during TDY #16 through TDY #45 for gasoline futures.
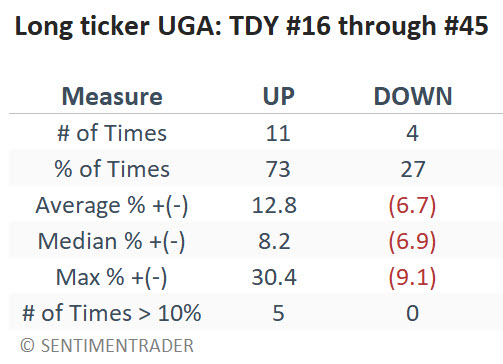
The table below summarizes performance results during this favorable seasonal period.
What the research tells us…
Unleaded gas is a highly cyclical market. It tends to show strength in the first half of the year and weakness during the second half. This market is now entering a period that has seen RB futures offer exceptional strength. That said, traders must recognize the exceptionally volatile nature of unleaded gas futures and the dangers of the leverage involved in futures trading. Non-futures traders wishing to play the long side of unleaded gas can look to ticker UGA, with the caveat that returns for the ETF have not been as robust as those for the futures.