
It's time to keep an eye on unleaded gas

Key points
- Unleaded Gas plunged in the last six months of 2022; it has been bouncing within a broad trading range since
- This highly cyclical market is entering its most favorable seasonal time of year
- A long-term view of trader's Optix just flashed a signal that higher prices have typically followed
- ETF ticker UGA offers an alternative to trading riskier unleaded gas futures
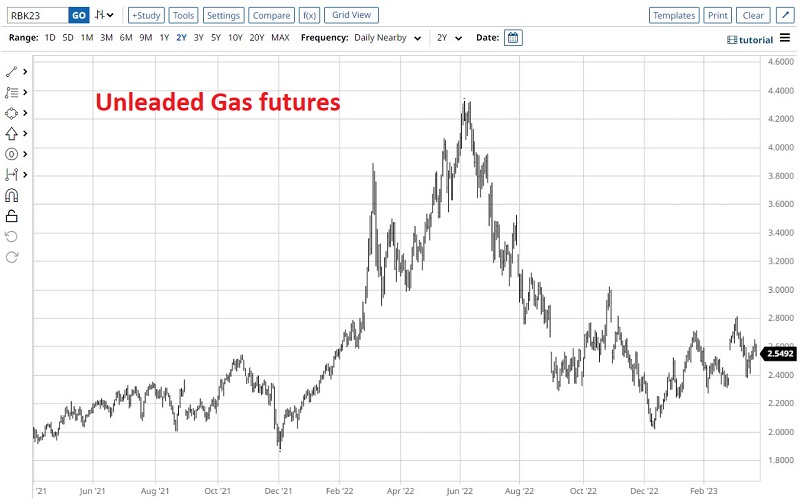
Unleaded Gas is a very volatile and cyclical market
The daily chart below (courtesy of Barchart.com) displays Unleaded Gas futures price action over the past two years.
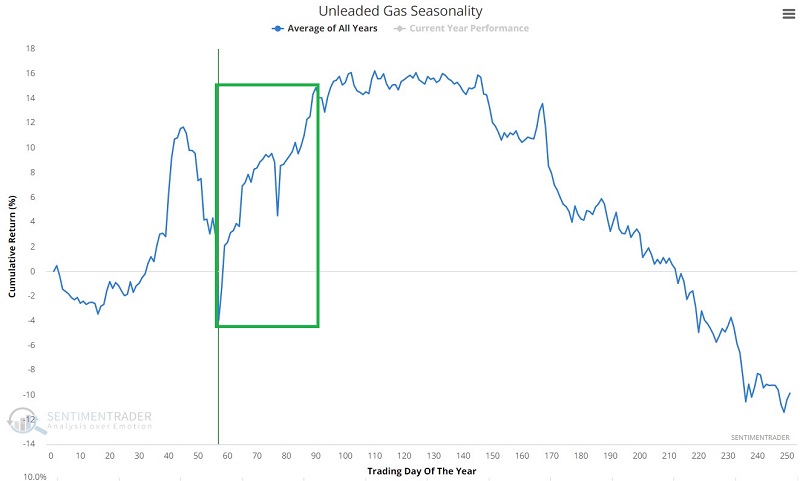
The chart below displays the annual seasonal trend for Unleaded Gas futures (ticker RB) and highlights the period that extends from the close of Trading Day of Year #57 through TDY #90. For 2023, this period extends from the close on 2023-03-24 through 2023-05-08.
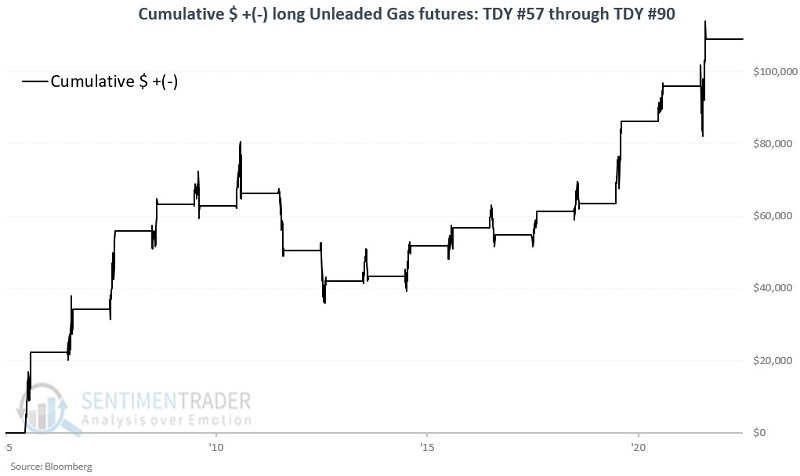
The chart below displays the cumulative $ +(-) from a long position in Unleaded Gas futures only during the TDY #57 through TDY #90 period since 2005.
The table below summarizes performance results during this favorable seasonal period.
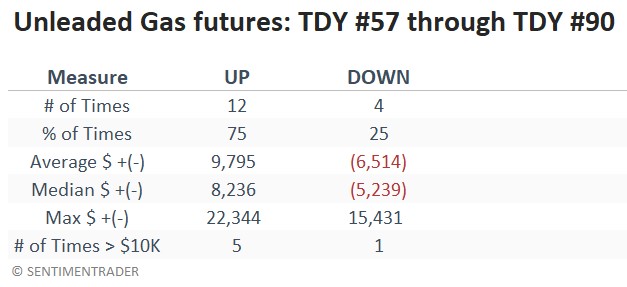
The good news is that historical results have been quite favorable overall. The bad news is that there is no guarantee that future results will be similar. Likewise, the fact remains that Unleaded Gas futures are inherently very volatile and require very deep pockets (and a solid understanding of the unlimited risk inherent in futures trading) to trade.
Unleaded Gas Optix quietly crosses a threshold
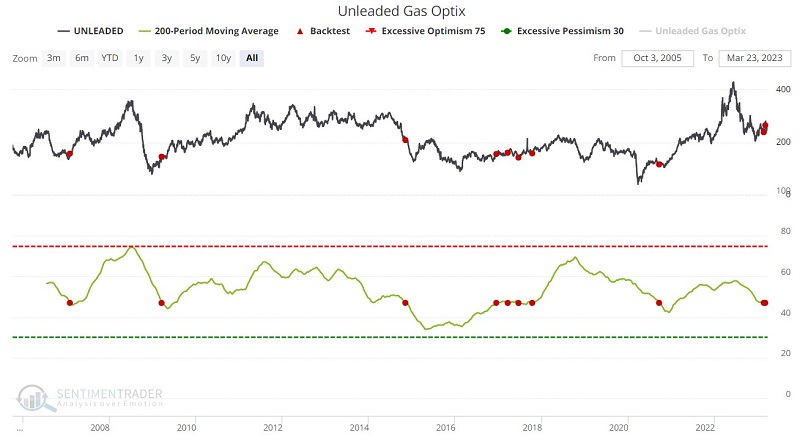
The green line in the chart below displays the 200-day moving average of Unleaded Gas Optix. The red dots highlight all days when the 200-day average crossed below 47.
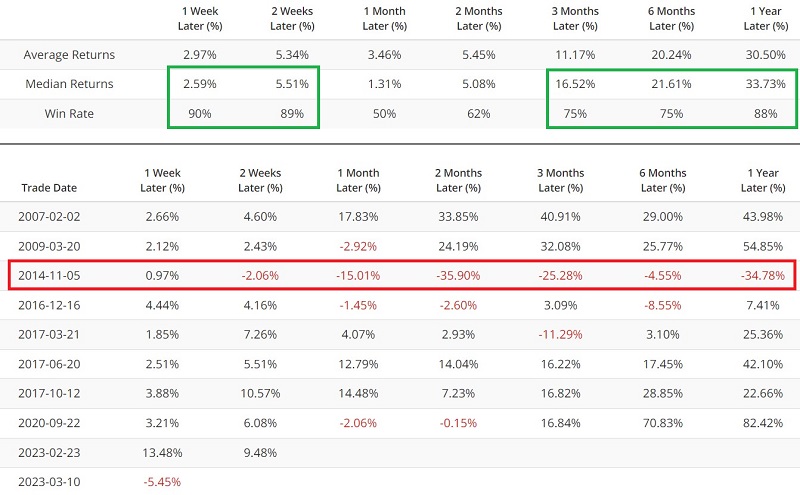
The table below summarizes Unleaded Gas performance following previous crosses below 47 (including overlapping signals). The caveat is the signal in 2014 which saw Unleaded Gas continue to plunge, falling another -34.78% in the ensuing twelve months. This reminds us that no signal eliminates a trader's responsibility to manage risk.
UGA as an ETF alternative
A potential alternative for those unwilling to accept the large dollar swings associated with Unleaded Gas futures is to trade shares of the United States Gasoline Fund LP ETF (ticker UGA). The good news is that UGA allows non-futures traders to gain exposure to the Unleaded Gas market just as they would by buying shares of stock. The caveats to consider before investing are the relatively low trading volume (roughly 35,000 shares per day) and the fact that at tax time - like many commodity ETFs - capital gains are reported on a K-1 (which some investors consider more complicated).
Per ETF.com:
UGA is the first ETP in the gasoline commodity space. The fund holds near-month futures contracts on RBOB gasoline that is for delivery to the New York harbor and rolls expiring front-month contracts to the next-nearest month. UGA invests primarily in RBOB futures contracts traded on the New York Mercantile Exchange (NYMEX) and may invest in forwards and swap contracts. As an ETF, UGA is structured as a commodities pool, so cap gains are taxed at a blended 60% long-term/40% short-term rate regardless of the holding period, and investors receive a K-1 at tax time.
Potential alternatives include the Invesco DB Energy fund (DBE), which tracks an index of five energy-related contracts, and the United States Oil Fund (USO), which holds near-term crude oil futures. DBE trades roughly 85,000 shares a day and has a correlation of approximately 90% to ticker UGA. USO is heavily traded (about 3.3 million daily shares) and correlates roughly 85% to ticker UGA.
Both DBE and USO also involve a K-1 form at tax time.
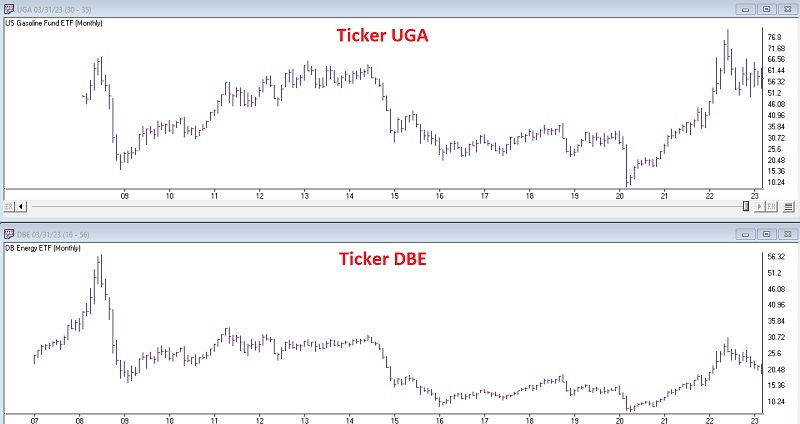
The chart below (courtesy of AIQ TradingExpert) displays the monthly price action of ticker UGA and ticker DBE.
What the research tells us…
Unleaded Gas is a highly cyclical market. It tends to show weakness during the winter months and then strength into mid-summer. That said, traders must recognize the exceptionally volatile nature of Unleaded Gas futures. Non-futures traders who wish to play the long side of Unleaded Gas may look to the United States Gasoline Fund LP ETF (ticker UGA). By doing so, a trader can get exposure to fluctuations in the price of gasoline as they would buy shares of stock.