
It's time to keep an eye on transports

Key Points
- The transportation sector has essentially gone nowhere for five years
- Investors have finally - and notably - thrown in the towel, possibly setting the stage for significantly better performance
- Other favorable weight of the evidence has appeared in more obscure places like the Copper/Gold Ratio and XLI insider selling
Transports have lagged but recently held support
The chart below displays price action for the iShares US Transportation ETF (ticker IYT). This ETF has traded sideways since late 2018 and badly lagged the S&P 500 Index.
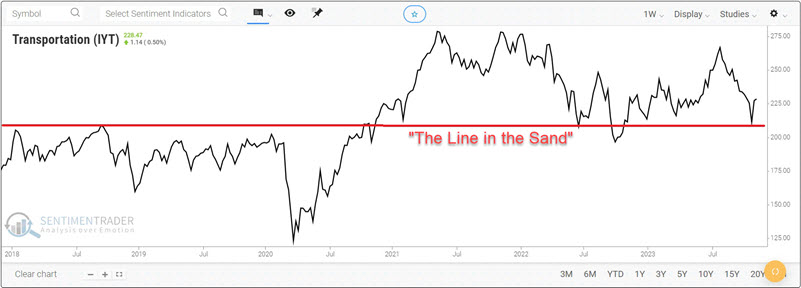
The one potential saving grace regarding price action is that the resistance level from 2018 (around $207 a share) has held repeatedly as support in 2022 and 2023. This could set the stage for a long-awaited rebound in transportation stocks - with a clear "line in the sand" stop-loss level below the red line in the chart above.
The information below details some potentially favorable developments for the transportation sector. However, given this sector's absolute and relative weakness in recent years, any bullish position taken in this sector should be considered highly speculative. Waiting for signs of an established uptrend might be an even better idea. Regardless, now is an excellent time to finally put the transportation sector back "on the radar."
Trader sentiment reaches a washed-out level
When a stock, index, sector, or market declines sharply in price or lags for an extended period, investors eventually "throw in the towel." This overly bearish sentiment frequently indicates that a bottoming out may be at hand and is often reflected in readings from our Optix indicator.
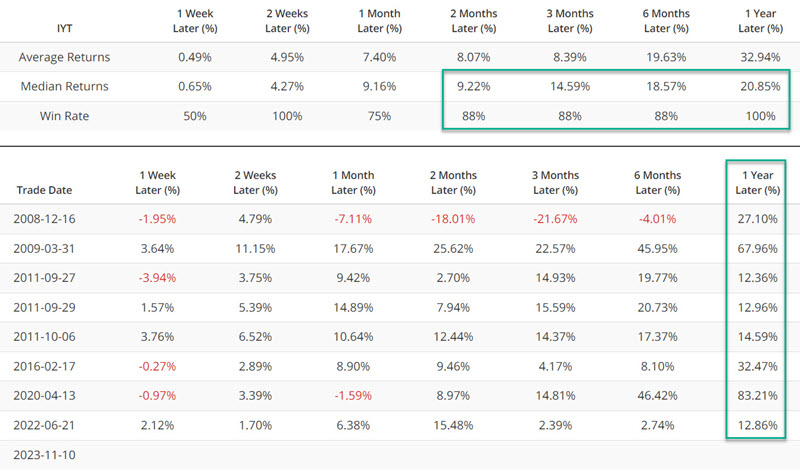
The chart below highlights when the 50-day average for IYT Optix crossed above 36%. The most recent signal occurred on 2023-11-10.

The table below summarizes subsequent IYT performance.
The Copper/Gold Ratio reaches an extreme reading
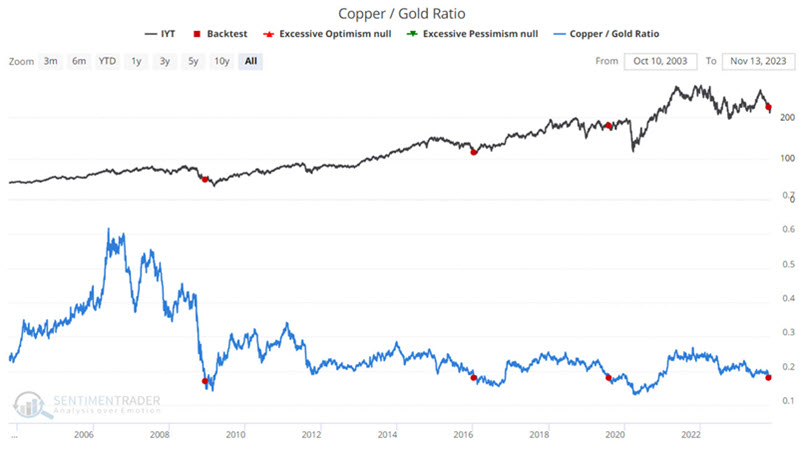
The Copper/Gold Ratio has an apparent impact on the economy - and, by extension, several commodities and commodity-related industries. Because of its heavy reliance on metals and energy-related commodities, the transportation sector often reacts strongly to extremes in the Copper/Gold Ratio.
The chart below highlights all days when the Copper/Gold Ratio stood below 0.18. The most recent date was 2023-10-20.
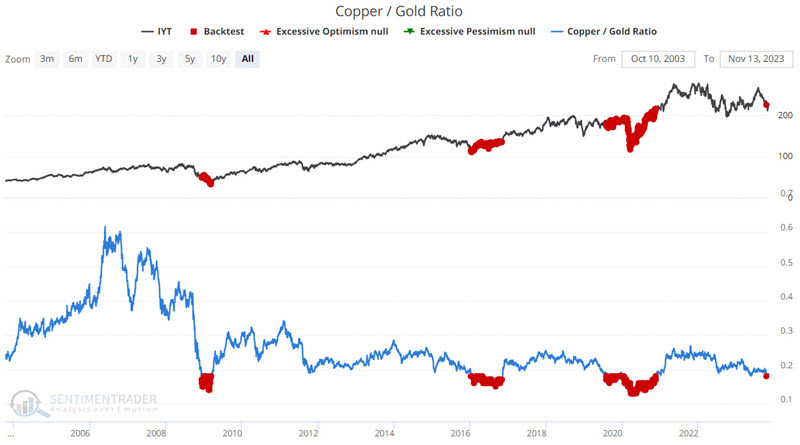
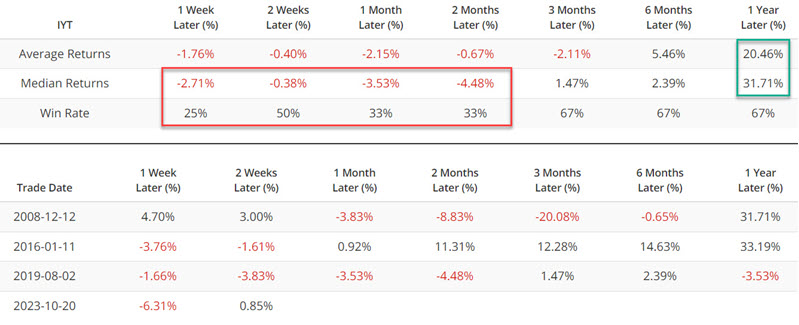
The clusters of red dots in the chart above suggest that low Copper/Gold Ratio readings tend to mark buying opportunities for transportation stocks. The results displayed in the table below seem to bear this theory out.
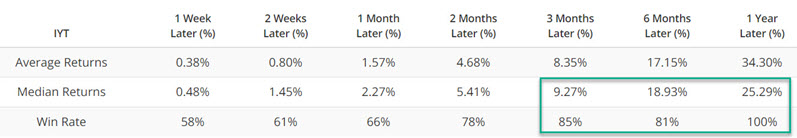
So far, ticker IYT has been higher 12 months later, 100% of the time, with spectacular average and median gains of 34% and 25%, respectively. Unfortunately, as always, past performance does not guarantee future results.
There are two other concerns. The most recent occurrence in October 2023 did not involve a "cluster" of days as in previous instances but rather a single day. There is no way to predict whether this will matter, but it is a concern. Also, we find less robust results if you look only at IYT performance following the first "red dot" in each previous instance.
The test below looks only at IYT performance following the first cross below 0.18 by the Copper/Gold Ratio.
Note in the table below that continued price weakness for ticker IYT following the first alert from the Copper/Gold Ratio was common. This suggests that investors not be too quick to commit heavily to the transportation sector until it shows signs of an actual reversal in trend.
One more potential ray of hope
This one goes off the beaten path a bit. However, it may have some merit. We do not track insider buying and selling for ticker IYT. That said, ticker IYT historically trades with roughly a 90% correlation to the Industrial Select Sector SPDR Fund ETF (ticker XLI). So, factors that affect XLI typically also affect ticker IYT. So here goes:
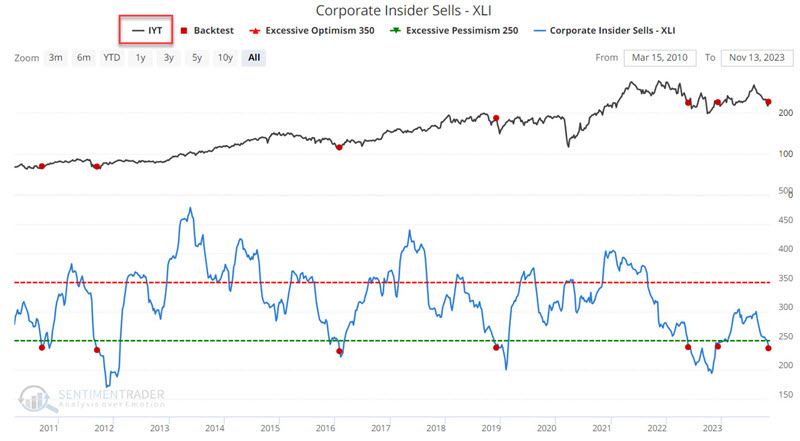
Corporate insider selling in XLI constituent stocks has recently plunged to a significantly low level. While insider buying is the best sign, an absence and/or sharp decline in insider selling can also signal an important level of bullishness among executives who know their companies and industries best.
The chart below highlights those dates when our Corporate Insider Sells - XLI indicator crossed below 240 for the first time in six months - but looks at the performance of ticker IYT instead of ticker XLI.
The table below summarizes subsequent performance for ticker IYT.
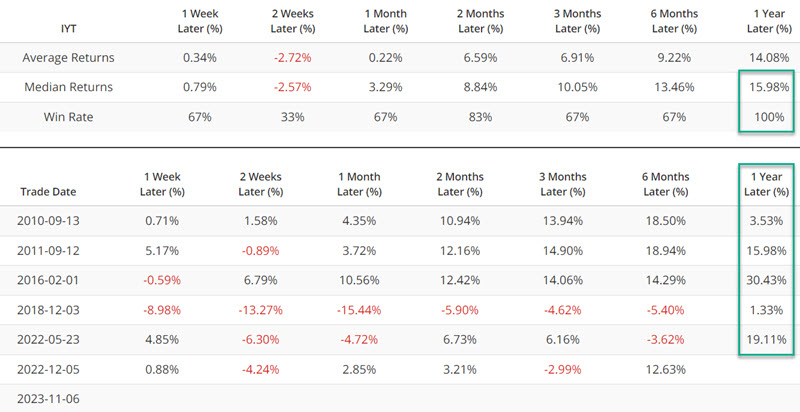
Continued weakness is not uncommon during the first month after a signal but is less common as time goes by. The good news is that IYT was higher 100% of the time twelve months later. However, the sample size is admittedly too small to allow us to draw conclusions. This recent signal, therefore, should be considered as potential weight of the evidence and NOT as some automatic buy signal.
What the research tells us…
In reality, the only sector that has significantly outperformed the S&P 500 in recent years is technology. The transportation sector has been unquestionably a laggard. The information highlighted above suggests that the transportation sector may be setting up for a period of decent performance - but there are no guarantees. The decision for investors is whether to a) commit capital to the transportation sector soon - in hopes of buying in near a potential bottom, or b) wait for signs of a reversal into an actual uptrend before taking the plunge. Either way, the time to start paying attention to the transportation sector is now.