
Its time to keep an eye on the US Dollar

Key points
- The U.S. Dollar enjoyed a great run from May 2021 into September 2022; since then, it has been in a steep decline
- A number of factors suggest the potential for a surprise rebound for the buck
- Below we highlight an example of one limited-risk, low-dollar risk way to play
Where the dollar has been and where it is now
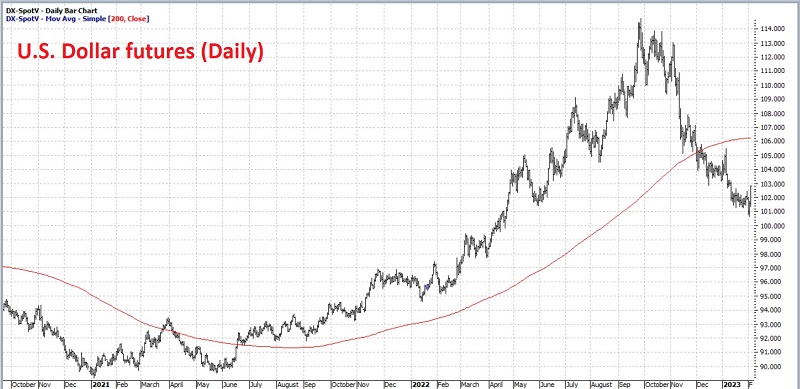
The chart below displays the action of U.S. dollar futures since late 2020. Price spent the first six months of 2021 forming a low, then rallied steadily for sixteen months before topping out in September 2022. The dollar then declined relentlessly before attempting to reverse higher in the last week.
Where to from here? Well, that is always a question that is open to debate and one that we do not attempt to answer definitively. Still, it is important to note that just as many traders begin to resign themselves to a lower dollar, a few potential positive signs have emerged.
Start with seasonality
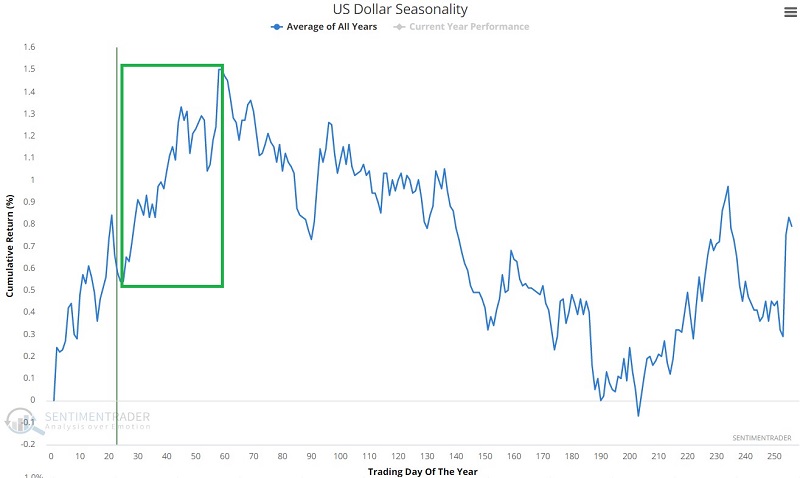
The chart below displays the annual seasonal trend for U.S. dollar futures. As you can see, the dollar is entering a favorable seasonal window. As always, seasonality is "climate, not weather," and there is never a guarantee that a given seasonal trend will play out as expected the next time around. Still, seasonality can often help point a trader in the right direction.
Since 1980, the dollar has advanced 61% of the time and declined 39% of the time between Trading Day of Year (TDY) #25 and TDY #58. For 2023, this period extends from the close on 2023-02-06 through 2023-03-23.
Another wild card: The Elliott Wave
Elliot Wave theory is founded in the notion that things in nature (including prices) move in 5 waves up - three up, two down alternatingly, and then five waves down - three down and two up. Belief in Elliott Wave among traders ranges from "it's my religion" to "it's ridiculous." I am not a huge proponent of Elliott Wave Theory (the primary problem for me personally is the typically subjective nature in which the waves are interpreted from one trader to the next). But I have known enough people who are that I occasionally pay attention under certain circumstances.
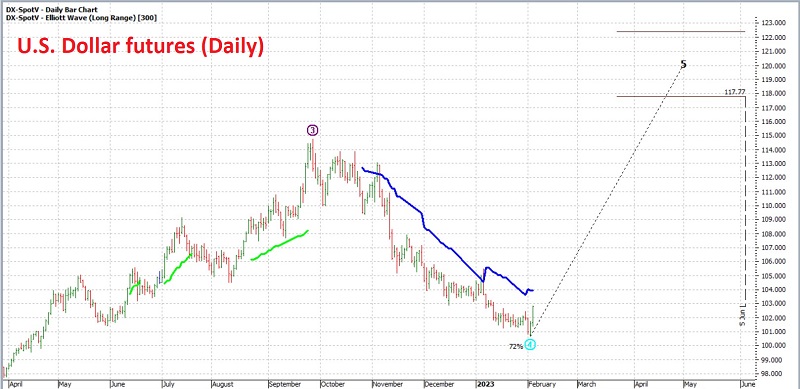
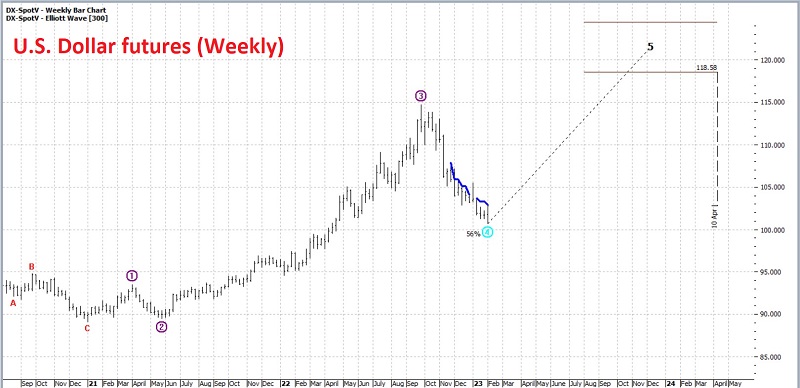
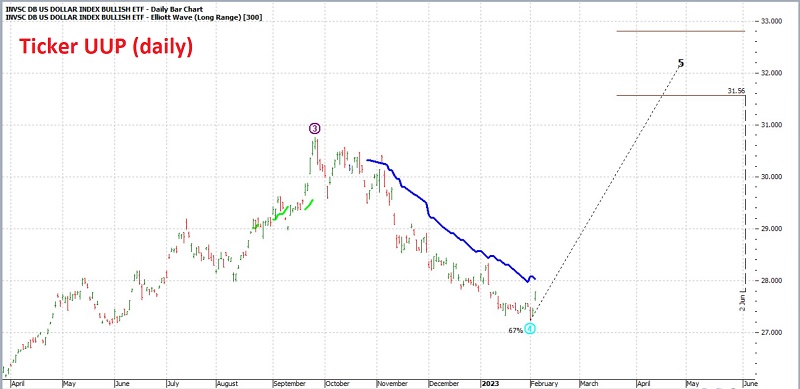
The two charts below (courtesy of ProfitSource by HUBB) display a daily and weekly chart for U.S. dollar futures with the daily and weekly Elliott Wave count drawn, respectively. While I do not rely on these charts to trigger trades, a) the wave counts - for better or worse - are generated using an objective algorithm (rather than someone's subjective interpretation), and b) it gets my attention when both daily and weekly charts are pointing to a Wave 5 higher (or lower). This does not mean that the price will, in fact, act as projected; it simply suggests a reasonable possibility.
Adding in a few technical factors
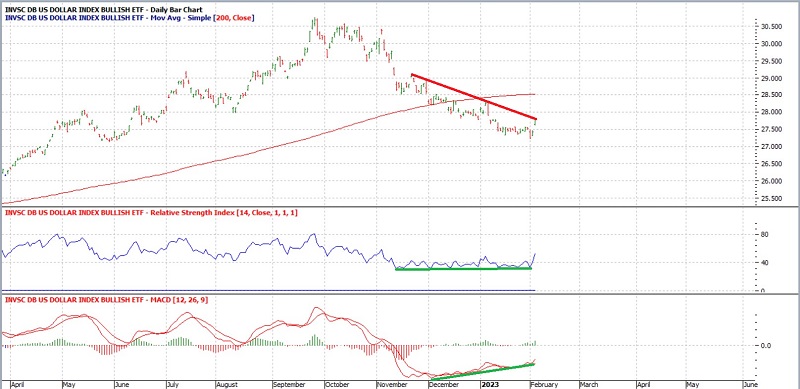
The chart below displays Invesco DB U.S. Dollar Index Bullish Fund ETF (ticker UUP) that tracks the U.S. dollar, along with two technical indicators - RSI and MACD. Both indicators are presently showing a positive divergence from recent price action - i.e., the indicators have trended sideways to higher while the price has declined. Like Elliott Wave, this represents the harder-to-quantify analysis we at Sentimentrader tend to avoid. In this case, I am merely pointing out certain factors to set the stage for the example trade that follows.
The chart below displays the ticker UUP with the daily Elliott Wave count from ProfitSource.
Making a bullish play in the U.S. Dollar
Let's assume that based either on the factors highlighted above - or on some other form of analysis - a trader wants to play the bullish side of the U.S. dollar. The most straightforward approach would be to buy U.S. dollar futures as a pure play on price movement. On the upside, the leverage involved in futures trading offers the potential for exceptional returns. To enter a long position of one U.S. dollar futures contract (as this is written) requires a margin deposit of $2,750. Each full point movement in the price of the futures contracts results in a gain or loss of $1,000. So large percentage gains (or losses) can accrue very quickly. The downside is that futures trading entails unlimited risk and is not for everyone.
An alternative for non-futures traders is to buy shares of ticker UUP, which trade like shares of stock. As this is written, the cost to buy 100 shares of UUP is roughly $2,800. Each $1 change in the price of UUP shares will result in a gain or loss of $100.
But for sake of example, let's assume a trader wants exposure to a long position in the U.S. dollar but is not willing to risk much money on this trade. One potential example trade involves a "bull call spread" strategy using options on ticker UUP.
Example Trade using UUP options
Our example position involves:
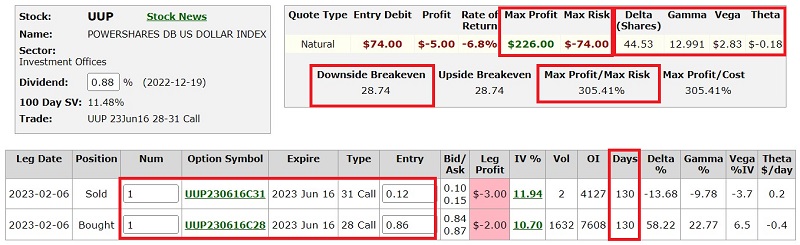
- Buying the UUP June16 2023 28 strike price call @ $0.86
- Selling the UUP June16 2023 31 strike price call @ $0.12
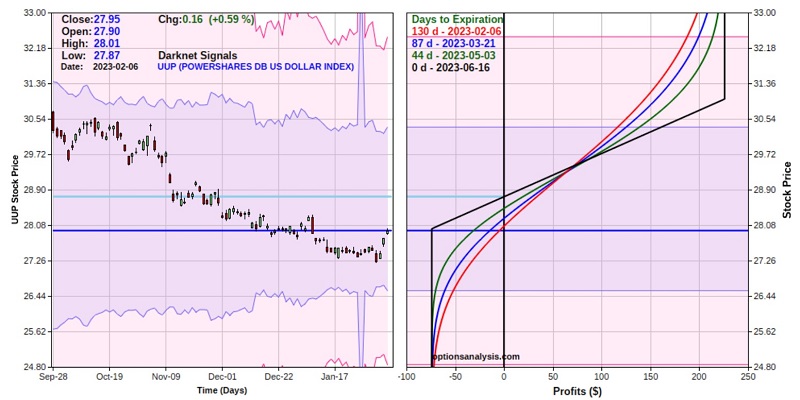
The particulars for this position and the risk curves (risk curves display the expected profit or loss as of a given date based on the price of UUP shares at that time) appear in the charts below (courtesy of Optionsnalysis.com).
Things to note:
- The cost to enter the trade - and the maximum risk - is $74 per 1-lot. A trader can adjust their lot size based on their maximum dollar risk level
- A trader with a $25K account willing to risk 2% (or $500) on a single trade could buy a 6-lot and risk $444
- The maximum profit potential on the trade is $226 per 1-lot and would be achieved if the trade were held until expiration and UUP was above $31 a share at that time
- The breakeven price for the trade at option expiration is $28.74. If we are still holding this trade at expiration, it will show a gain if UUP is trading above the price and a loss if it is trading below
The 1-lot position has a:
- Delta of 44.53. This suggests that the position will act much like a position holding long 44 (or 45) shares of UUP
- Gamma of 12.99. This tells us that the position will gain roughly 13 deltas if UUP rises $1 in price
- Vega of $2.83. This means that the position will gain or lose $2.83 of value based on a one full percentage point movement in implied options volatility. A rise in volatility will increase the position's value and vice versa
- Theta of -$0.18. This means that this position will lose $0.18 of value due solely to the passage of one day of time. Note that time decay accelerates in the last 30 days before option expiration. At the moment, theta is not a major factor, as there are 130 days left until expiration
Managing the position
There are no hard and fast rules for managing a bull call spread. In general, a trader should consider what level of profit he or she would be willing to accept and/or what price level on UUP, or what level on another indicator, might suggest profit-taking is in order. Once an option trade reaches a certain level of open profit, there may be an opportunity to adjust the position to lock in a profit and then let the adjusted position ride.
On the downside, the trader should decide in advance how they will react if UUP declines in price after the trade is entered. Just below the recent low of $27.22 a share is a natural "Stop loss" level. However, if a trader thinks the dollar will rally in the next several months and the total dollar commitment is within their acceptable dollar loss range, they can "let it ride" even if the recent UUP low is taken out.
What the research tells us…
Looking solely at recent price action and the 200-day moving average, the U.S. dollar is arguably in a downtrend. On the other hand, if one focuses on other factors such as seasonality, Elliott Wave, and indicator divergences, it is possible to make a bullish case for the dollar. The key is recognizing that there is a difference between "analyzing" a market and actually "trading" a market.
Once a trader makes a bullish or bearish determination, the next step is to decide whether or not to risk money on the idea. Finally, the trader must decide how to play, how much capital to commit, how much of that capital to actually risk, and finally, how to manage the trade. Lastly, when trading against the prevailing trend or when playing a low-conviction situation, a limited-risk, low-dollar risk option position can make a great deal of sense.