
It's time to keep an eye on the US Dollar

Key points
- The U.S. Dollar has been advancing steadily since mid-July
- Price appears poised to break out to a 2023 high, but the buck is entering a seasonally weak period
- A longer-term cycle for the Dollar remains unfavorable
The Dollar is rallying… but seasonality may be a headwind
On the right-hand side of the chart below, we see that the U.S. Dollar (USD) topped out in September 2022, then declined into July 2023. Since then, the USD has been advancing steadily.
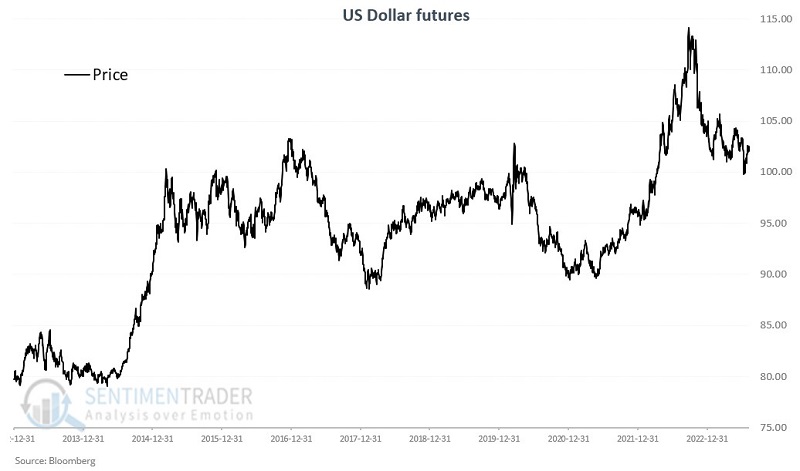
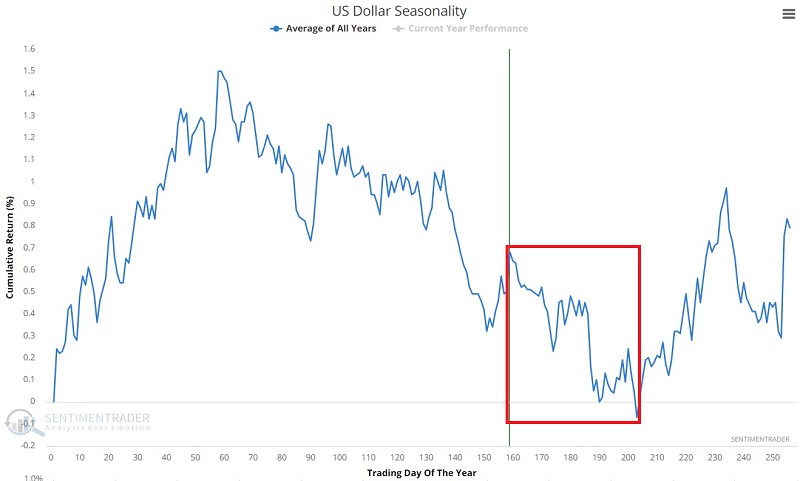
Can this recent advance continue? Of course. However, seasonality warns us to consider the potential for a reversal. The chart below shows that USD is about to enter an unfavorable seasonal period. This period will last from the close on 2023-08-14 through 2023-10-23.
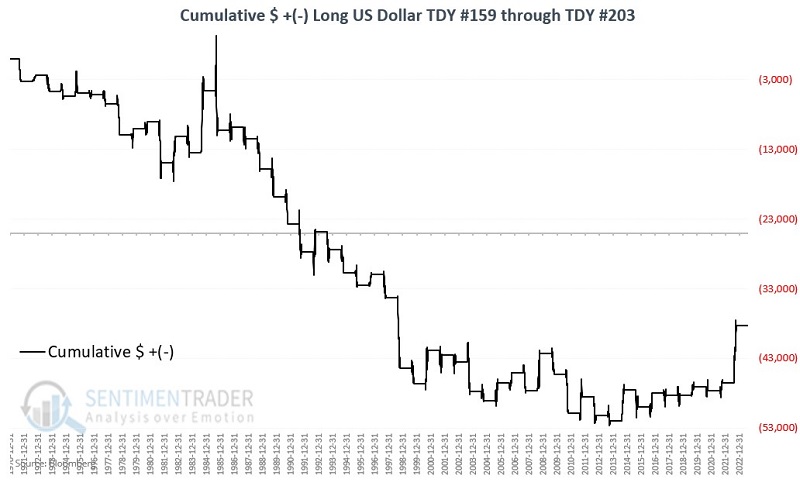
The chart below displays the cumulative hypothetical $ gain/loss achieved by holding a long position in USD futures only from the close on Trading Day of the Year (TDY) #159 through the close on TDY #203.
The table below summarizes USD performance during this period.
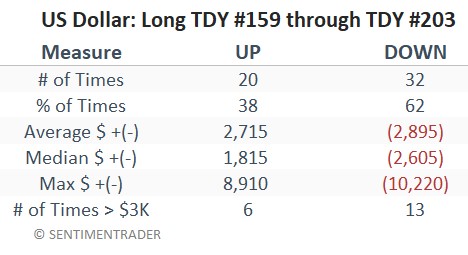
As with virtually all seasonal trends, there is no guarantee that the Dollar will fall in the months ahead (for the record, this supposedly "unfavorable" period has shown a gain in 5 of the last nine years). Nevertheless, the point is not in trying to predict whether the Dollar will reverse. The point is this: if the Dollar does reverse to the downside soon, aggressive traders might consider looking for an opportunity to play the U.S. Dollar from the short side.
A longer-term cycle remains unfavorable
Many years ago, I discovered a 16-year (yes, year) cycle in the USD. In brief, since March 1969, the U.S. Dollar has alternated between eight unfavorable years and eight favorable years. That cycle is discussed in detail in this article, dated 2021-06-01. Rather than rehashing it here, I encourage you to read the previous article. Still, to get the idea, the chart below displays cumulative $ +(-) for U.S. Dollar futures during favorable 8-year periods (black line) versus unfavorable 8-year periods (blue line)
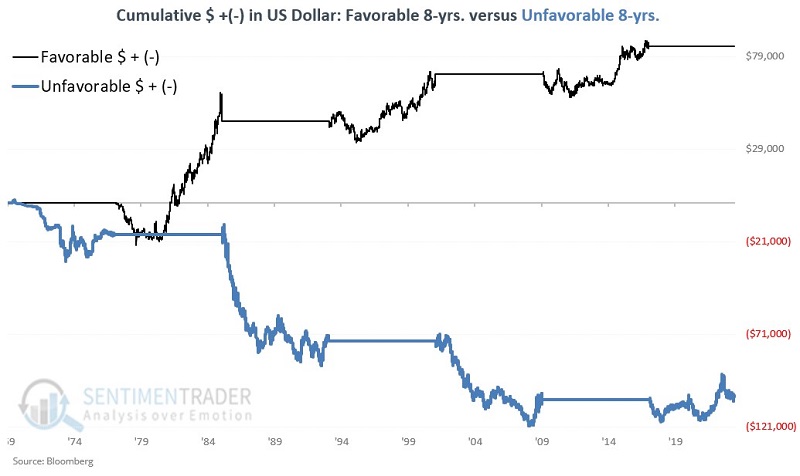
The critical thing to note is that the latest phase of this 16-year cycle is bearish on the USD from 2017-03-31 through 2025-03-31 (so far, the Dollar is actually up just less than 3% since the end of March 2017, i.e., technically not bearish, but also not very bullish). The other key thing to note is that June through December of unfavorable 16-year cycle years (Yes, 2023 is technically an unfavorable year in the context of this particular cycle) has shown a strong tendency for weakness.
For the record, unfavorable years have included:
- April 1969 through March 1977
- April 1985 through March 1993
- April 2001 through March 2009
- April 2017 to the present
The chart below displays the hypothetical cumulative $ +(-) from holding a long position in U.S. Dollar futures only:
- From June 1st through December 31st
- During the unfavorable years listed above
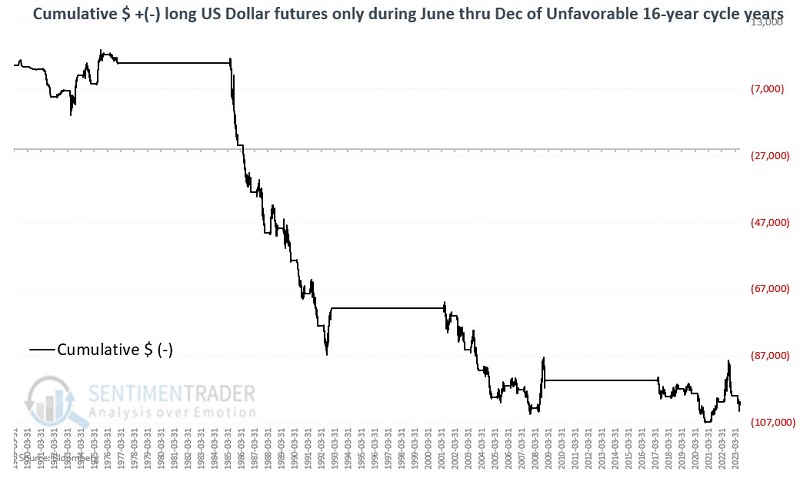
The cumulative hypothetical result so far is a loss of just over -$100,000. While this guarantees nothing, it strongly suggests an eye out for an opportunity to play the short side in the dollar between now and the end of the year.
What the research tells us…
The danger of relying solely on seasonal trends is that they are sometimes 100% wrong. Hence, they should rarely be relied upon as a standalone timing tool. That said, knowing historical tendencies can provide a trader with an "edge." Looking solely at the recent price action in the U.S. Dollar might lead one to adopt a bullish outlook. And price can continue to run higher. However, the shorter-term annual seasonal trend and the longer-term 16-year trend point to the potential for weakness in the months directly ahead. As a result, a trader might watch the Dollar closely for signs of a downside reversal and consider playing the short side.