Products
SentimenTrader Trading Tools
‍
Backtest Engine
My Trading Toolkit
Correlation Analysis
Seasonality
Market Prediction
Indicators & Data API
‍
Proprietary Indicators & Charts
Market Data API
Strategies & Scanner
‍
50+ Trading Strategies
Smart Stock Scanner
Smart Option Scanner
Research Reports
‍
Research Solutions
Reports Library
Free Resources
Simple Backtest Calculator
Simple Seasonality Calculator
The Kelly Criterion Calculator
Sentiment Geo Map
Public Research Reports
Education
Sentiment Indicators
Technical Indicators
Pricing
Company
About
In the News
Testimonials
Client Success Stories
Contact
Log inLoginSign up
< BACK TO ALL REPORTS

It's time to keep an eye on the US Dollar

Jay Kaeppel
2022-03-29
The US Dollar has enjoyed a strong run over the past ten months. However, several seasonal, sentiment, and price indicators suggest the potential for less favorable action in the months ahead.

Key Points

  • Despite low rates, high debt, and competition from Bitcoin, etc., the US Dollar has performed very well since bottoming in May 2021
  • Unfortunately, the dollar is now entering a period of typical seasonal weakness
  • Additionally, sentiment has reached a bullish level that has presaged dollar weakness in the past

Seasonality

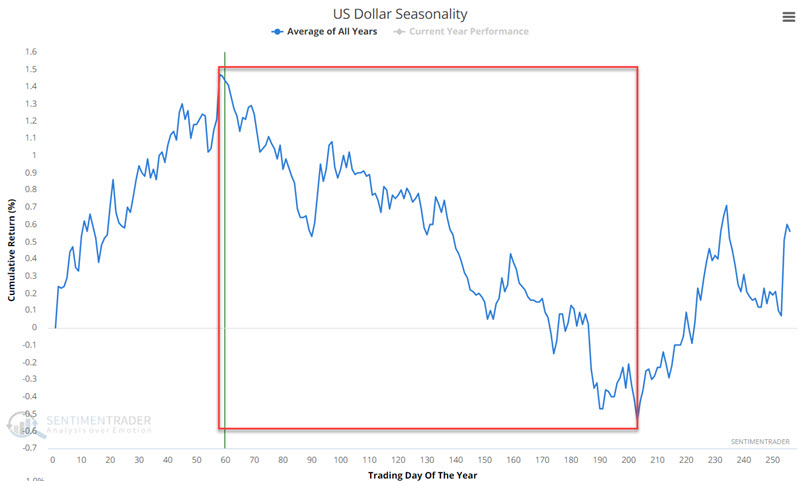
The chart below displays the annual seasonal trend for the US Dollar. Note the large unfavorable period over much of the year - extending from Trading Day of the Year (TDY) #59 through TDY #203. For 2022, this period extends from 3/24 through 10/18.

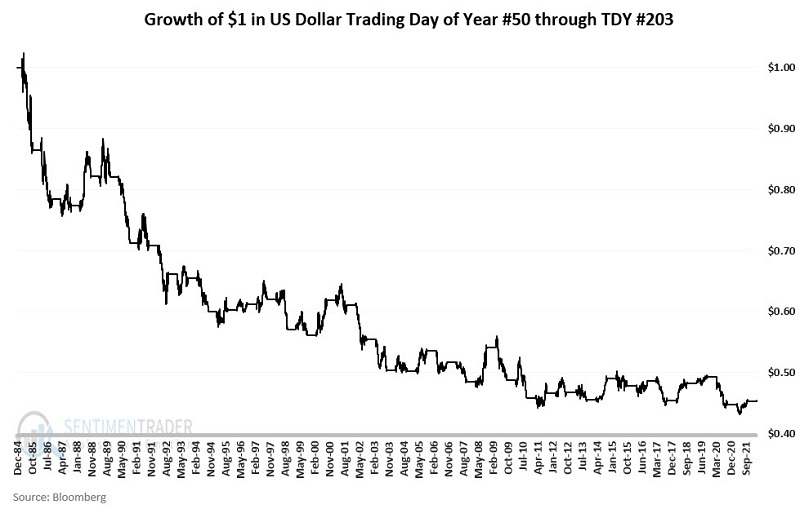
The chart below displays the growth of $1 invested in the US Dollar only during this unfavorable period every year starting in 1985.

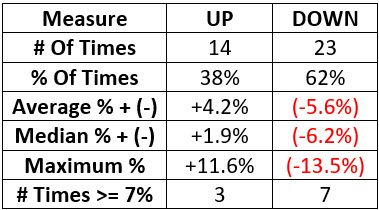
The table below displays a summary of annual results.

Dollar Optix

The chart below displays the action of the US Dollar in the top clip and the 100-day moving average of Dollar Optix in the bottom clip. The red dots highlight those times when the 100-day average for Dollar Optix crossed above 65. This represents an extended period of high optimism regarding the dollar.

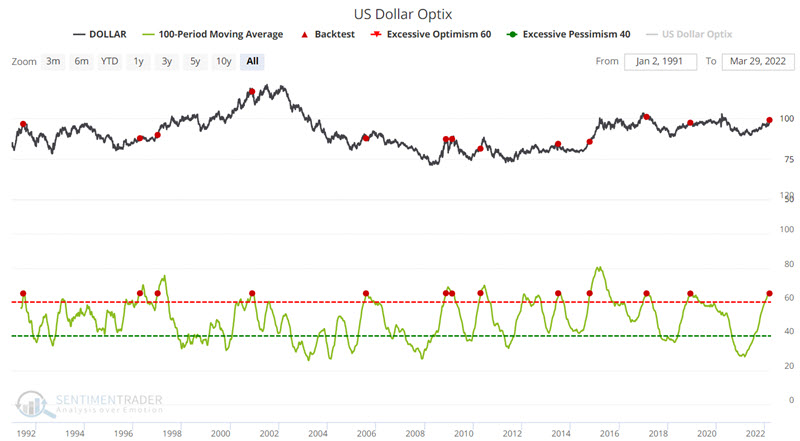
The table below displays a summary of the results following previous signals.

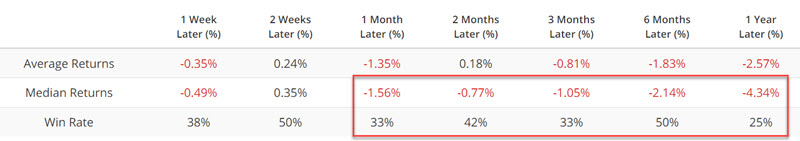
What the research tells us…

The US Dollar has enjoyed a strong uptrend in recent months. And for the moment, at least, that trend remains intact. Nevertheless, as you can see in the monthly chart below (courtesy of ProfitSource), the dollar faces significant resistance in the 100-105 range. 

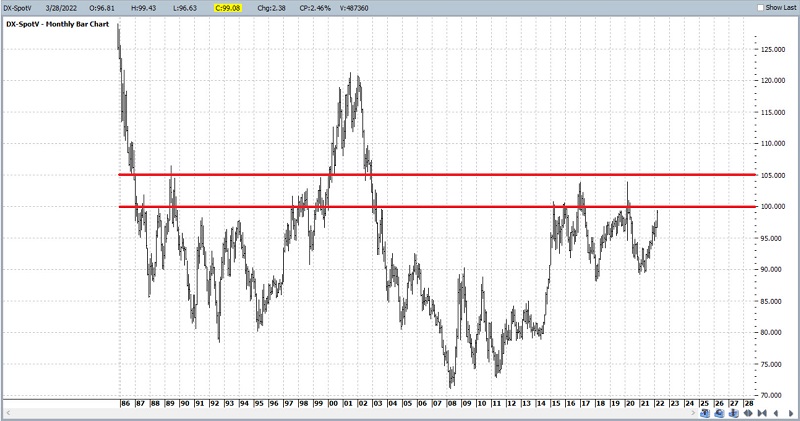
In light of the potentially limited upside, combined with the seasonal and sentiment headwinds detailed above, traders and investors may wish to consider dialing back some of their recent bullishness. A trader wishing to fade the current trend may look at ticker UDN (Invesco DB US Dollar Index Bearish Fund), an ETF that trades inversely to US Dollar futures. 

PRODUCTS
SentimenTrader
Trading Tools
Indicators & Data API
‍
Strategies & Scanner
‍
Research Reports
FREE
RESOUrCES
Simple Backtest
Calculator
Simple Seasonality
Calculator
The Kelly Criterion
Calculator
Sentiment Geo Map
‍
Public Research Reports
‍
Education
Sentiment Indicators
‍
Technical Indicators
‍
Pricing
Bundle pricing
‍
FAQ
‍
Announcements
‍
COMPANY
‍
About
‍
In the News
‍
Testimonials
‍
Client Success Stories
CONTACT
‍
General Inquiries
‍
Media Inquiries
‍
Financial Professionals Inquiries
‍
© 2026 Sundial Capital Research Inc. All rights reserved.
Setsail Marketing
TermsPrivacyAffiliate Program
Risk Disclosure: The information and tools provided are for research and analytical purposes only and are not intended as investment advice. Market analysis involves uncertainty, and outcomes may differ from expectations. Users should conduct their own due diligence and consider their individual circumstances before making any financial decisions. Past performance is not necessarily indicative of future results.

Hypothetical Performance Disclosure: Hypothetical performance results have many inherent limitations, some of which are described below. No representation is being made that any account will or is likely to achieve profits or losses similar to those shown; in fact, there are frequently sharp differences between hypothetical performance results and the actual results subsequently achieved by any particular trading program. One of the limitations of hypothetical performance results is that they are generally prepared with the benefit of hindsight. In addition, hypothetical trading does not involve financial risk, and no hypothetical trading record can completely account for the impact of financial risk of actual trading. for example, the ability to withstand losses or to adhere to a particular trading program in spite of trading losses are material points which can also adversely affect actual trading results. There are numerous other factors related to the markets in general or to the implementation of any specific trading program which cannot be fully accounted for in the preparation of hypothetical performance results and all which can adversely affect trading results.

Testimonial Disclosure: Testimonials appearing on this website may not be representative of other clients or customers and is not a guarantee of future performance or success.