
Its time to keep an eye on the real estate sector

Key points
- The real estate market is highly cyclical, with trends that can last for years
- In the stock market, the real estate sector has annual seasonal biases
- If history proves accurate this time around, this sector may perform very well between now and early February 2025
IYR seasonality offers clues
Our annual seasonal trend charts display an average of annual historical performance for a given sector, index, ETF, or commodity. By looking at trading days of the year (TDY), we can identify periods that have tended to see meaningfully favorable - or unfavorable - price performance
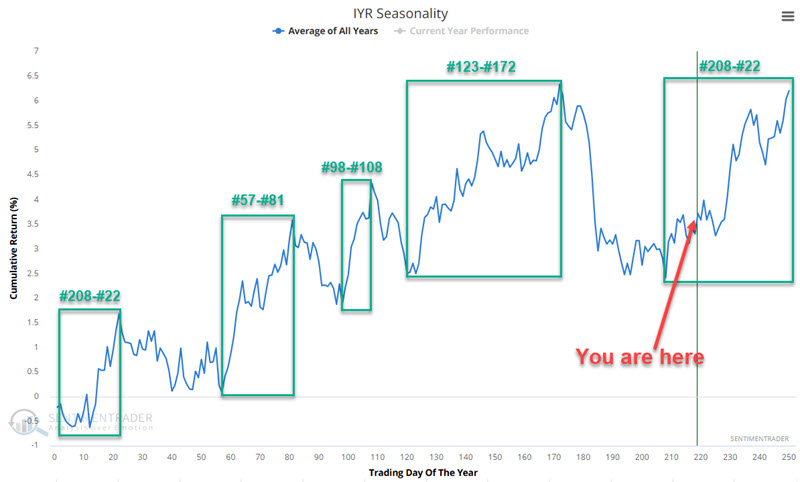
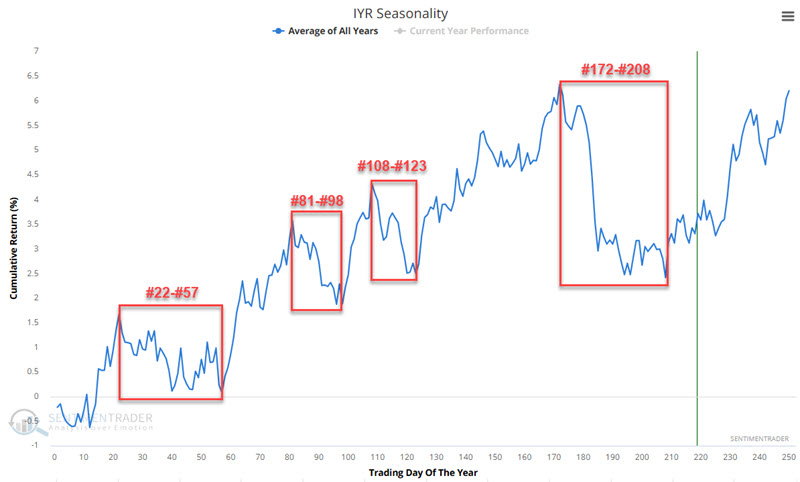
The charts below display the annual seasonal trend for the iShares U.S. Real Estate ETF (IYR), with various "favorable" and "unfavorable" times of year highlighted. The first chart notes that we are presently in what tends to be a favorable period for this sector.
As always, seasonality is NOT a roadmap, and no investor should assume that the real estate sector will conform to these historical averages during any given year. Likewise, using seasonality and price action to confirm one another is typically the best approach.
Focusing on the current favorable period
The good news is that a "favorable" seasonal period began on Trading Day of the Year #208 (2024-10-28) and extends through Trading Day of the Year #22 for 2025 (2025-02-03). The bad news is that so far, the real estate sector has been down roughly -2% since the close on October 28th.
The question is, "Is this just an even better buying opportunity? Or is the market not going to follow the seasonal trend this time?" In reality, the answer is "No one can predict."
So, to better handle expectations, let's examine the real estate sector performance during this supposedly favorable TDY #208 to TDY #22 period.
A historical test of the late-year/early-year period
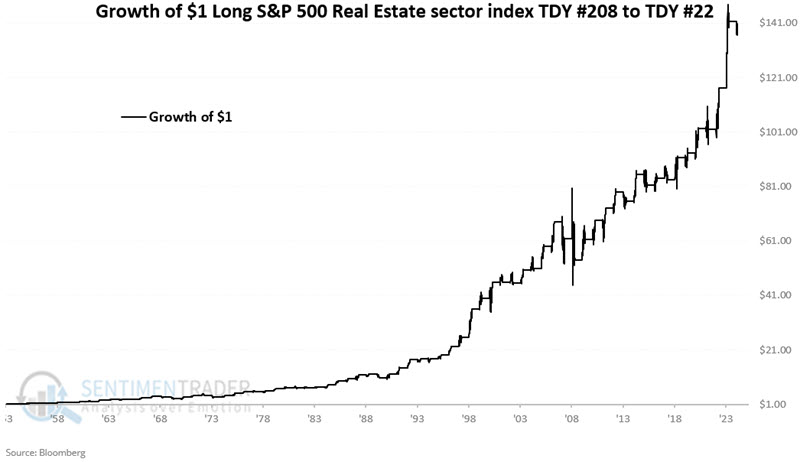
We will use the S&P 500 Real Estate (SPRE) sector index starting in October 1953 for testing purposes. The chart below displays the hypothetical growth of $1 invested in SPRE from the close of TDY #208 through the close of TDY #22 the following year, every year since 1953.
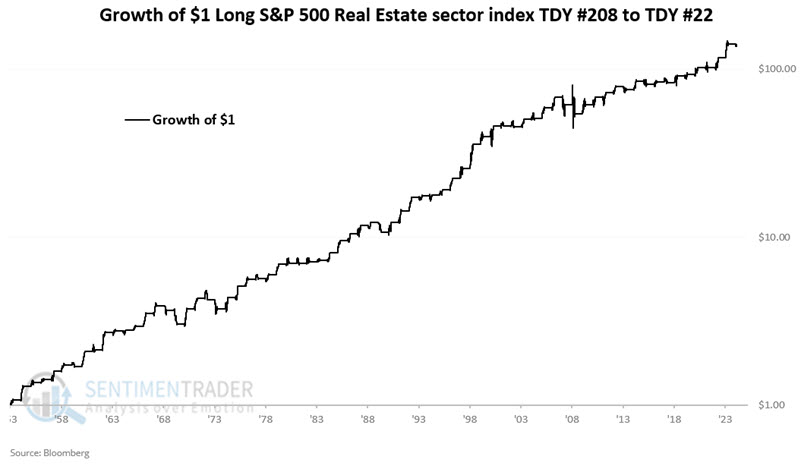
The chart below shows the same data plotted on a logarithmic scale.
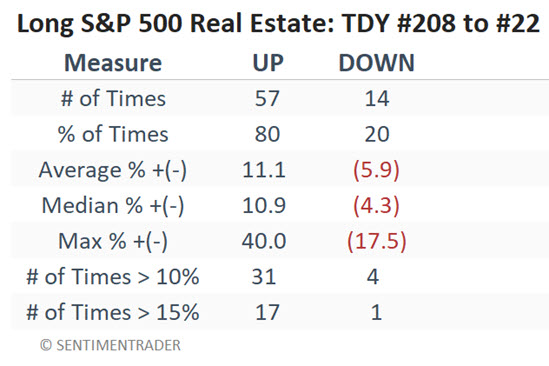
The table below summarizes the results.
The chart below displays the price action for ticker IYR.
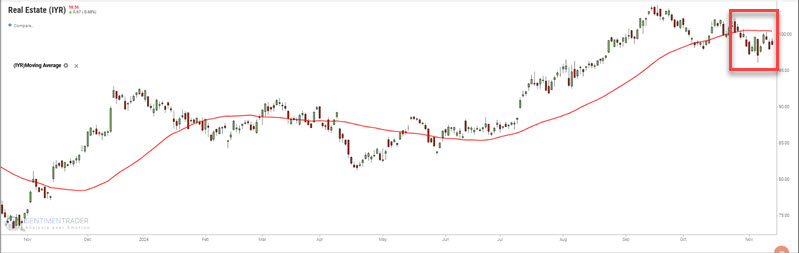
A trader looking at the real estate sector regarding the current seasonally favorable period has three basic choices:
- Use the recent dip as a buying opportunity in anticipation of a rebound
- Wait for price action to confirm (for example, wait for the price to move back above the 50-day moving average)
- Stand aside
What the research tells us…
The real estate sector has shown a gain of 80% of the time during the current period over the past 71 years. While this implies a potential "edge," it is also far from a sure thing. The historical numbers skew heavily to the positive side (median gain of +10.9% vs. a median loss of -4.3%) as they have big moves (17 gains of 15% or more with only one loss greater than 15%). Still, the sector has lost over 10% during this period on four occasions. Ultimately, each investor must decide a) Whether or not to play, b) how much capital to commit, and c) how much capital to risk.