
Its time to Keep an Eye on the Gold/Silver Ratio

Key points:
- Gold and silver are both considered "precious metals" (although silver has many more industrial uses than gold)
- Interestingly, while price fluctuations are highly correlated (0.92 since 1975), there has been a significant ebb and flow to the relationship in terms of the magnitude of price fluctuations
- This note examines one approach to trying to gain an edge in trading gold and silver
Let's start by invoking:
Jay's Trading Maxim #40b: No style, sector, index, or asset EVER holds a permanent advantage.
The relationship between Gold and Silver is a prime example of this adage. The chart below shows the price of gold relative to silver at the end of each week. We can observe a clear ebb and flow regarding which market leads at any given point in time. When the ratio is rising, it means gold has been outperforming, and vice versa.
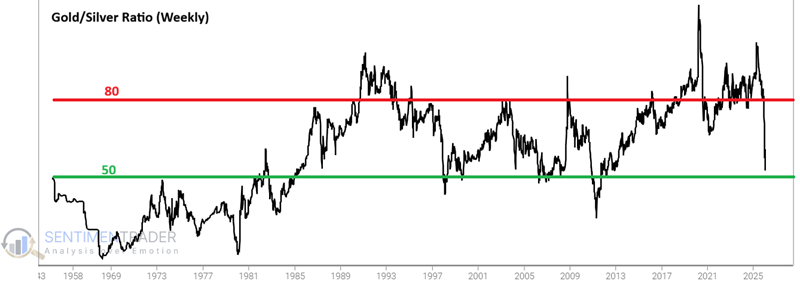
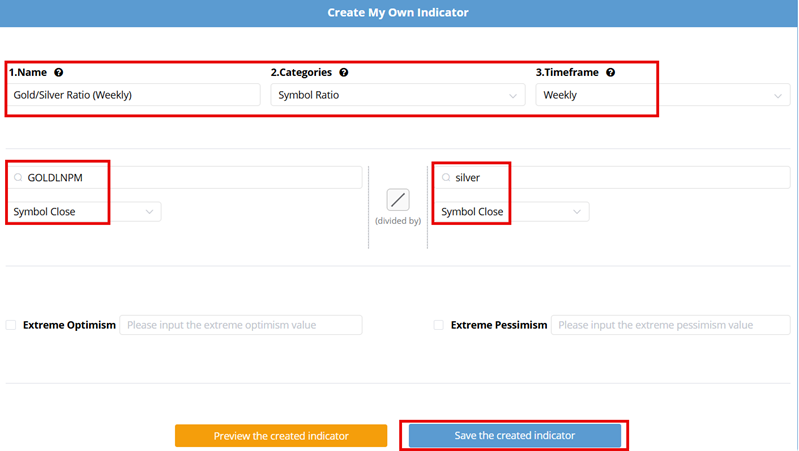
The chart above uses the tickers GOLDLNPM and Silver in My Stuff | My Indicators, with the inputs below.
The 50/80 Approach to Gold and Silver
The method I highlight next is not necessarily intended to be used as a standalone trading system. Likewise, investing in gold and/or silver does not have to be an all-in proposition on gold or all-in on silver. Nevertheless, for the sake of illustration, that is precisely how we will treat it: the "strategy" will always be either fully invested in gold or fully invested in silver.
For our test, we will:
- Hold gold once the Gold/Silver Ratio (GSR) falls to 50 or lower
- Hold silver once the Gold/Silver Ratio (GSR) rises to 80 or higher
Our test starts using week-ending price data on January 3rd, 1975. At that time, gold was trading at $174 an ounce and silver at $4.349. With the GSR at 40.01, we would have bought gold.
It was not until August 31st, 1990, that the GSR rose above 80. By that time, gold was trading at $387.75 (up 122.8%), and silver was at $4.830 (up 11.1%).
From there, the GSR stayed above 50 until December 12th, 1997. During the intervening 7 years and 4 months, gold fell to $283 (-27.0%), while silver rose to $5.89 (+21.9%).
The ratio has continued to swing back and forth as detailed below.
Period #1: After GSR drops below 50, until it rises to 80
The table below displays the performance for gold and silver during periods when the GSR fell below 50 until the next time it exceeded 80.
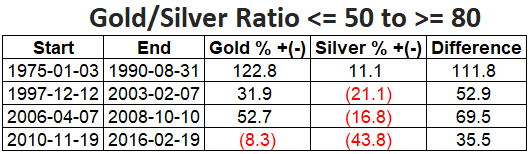
We note that in each of the periods listed in the table above, gold significantly outperformed silver.
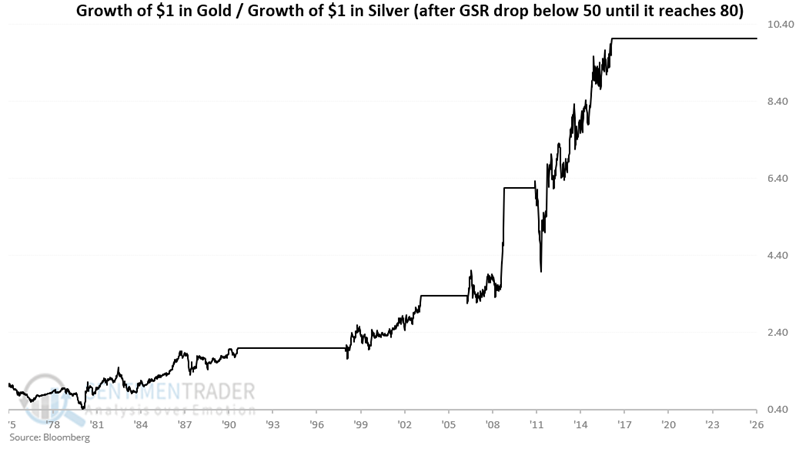
The chart below shows the hypothetical growth of $1 invested in gold and silver only during the periods highlighted in the table above (i.e., from the time the GSR drops to below 50 until it reaches 80 or above). $1 in gold grew to $4.12, a +311% increase. $1 in silver declined to $0.41, a -59% decline.
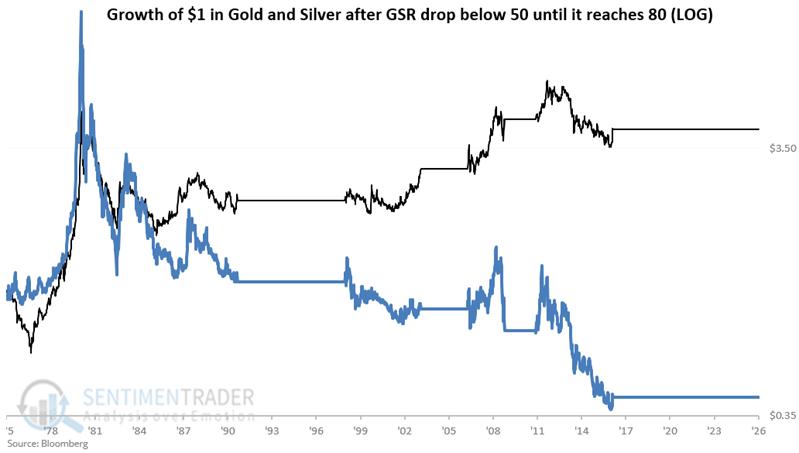
One word of caution (and the reason this strategy is not necessarily recommended as a standalone approach) is that gold's price volatility (the black line in the chart above) is high, with several significant drawdowns. Still, the point is gold's return relative to silver.
The chart below compares the hypothetical growth of $1 in gold to that of $1 in silver during the periods highlighted above. Clearly, gold has generally been the place to be when the GSR drops below 50 until it rises to 80.
Period #2: After GSR rises to 80 or higher, then falls back to 50
The table below displays the performance for gold and silver during periods when the GSR rose to 80 or higher until the next time it dropped to 50 or lower.
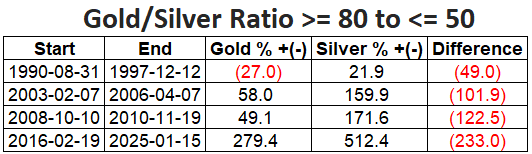
We note that in each of the periods listed in the table above, silver significantly outperformed gold.
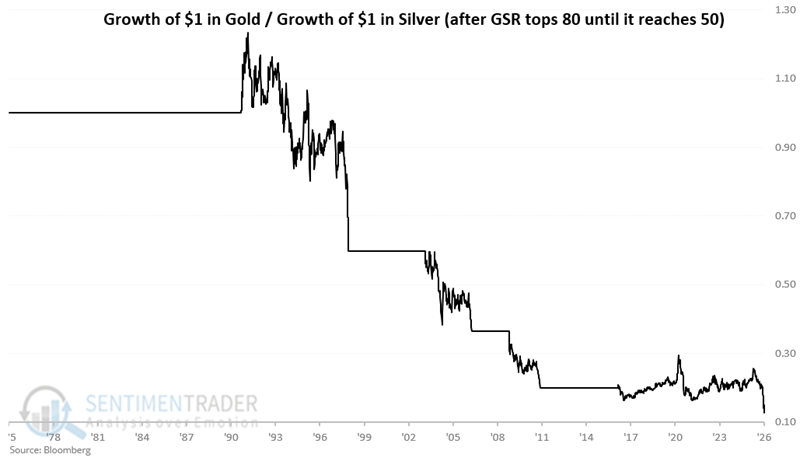
The chart below shows the hypothetical growth of $1 invested in gold and silver only during the periods highlighted in the table above (i.e., from the time the GSR topped 80 until it reached 50 or below). $1 in gold grew to $6.44, a +544% increase. $1 in silver rose to $50.53, or +4,953%.
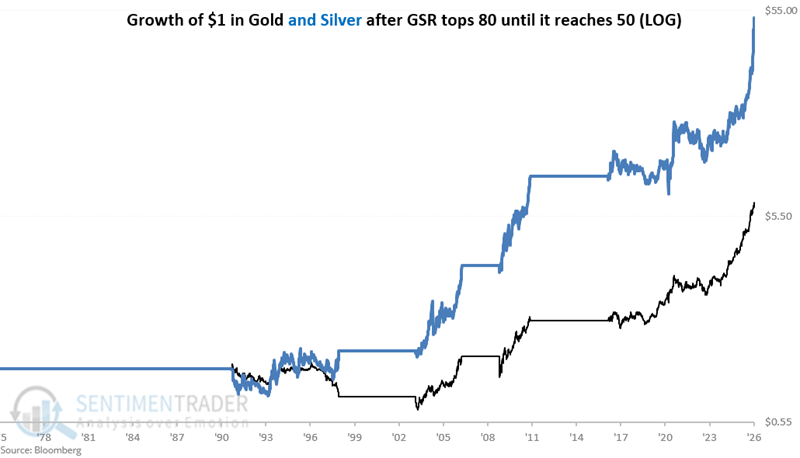
The chart below compares the hypothetical growth of $1 in gold to that of $1 in silver during the periods highlighted above.
Putting the two periods together
Now let's compare:
- Strategy #1: Holding gold after GSR drops to 50 or below and holding silver after GSR rises to 80 or above
- Strategy #2: The inverse (i.e., holding silver after GSR drops to 50 and gold after GSR rises to 80 or above)
The chart below compares the hypothetical growth of $1 invested under Strategy #1 with that under Strategy #2 (the inverse of Strategy #1). $1 using Strategy #1 grew to $207.97, or +20,697%. $1 invested using Strategy #2 grew to $2.64, a 164% increase.
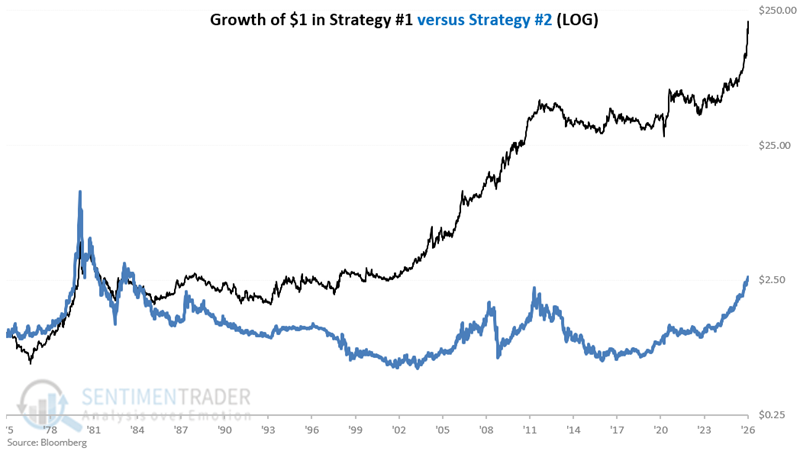
For comparison, $1 invested in gold buy-and-hold grew to $26.50, a 2,550% gain. $1 invested in silver buy-and-hold grew to $20.72, or +1,972%.
The current status
The Gold/Silver Ratio, as we calculate it, closed the week of January 16th at 51.16, the lowest reading in the past 13+ years. The rudimentary model above requires the ratio to close a week at 50 or below to trigger a new signal favoring gold over silver. So for now, it still favors silver. But at this point, it bears monitoring every week to see if the GSR dips to 50 or below, which would then suggest favoring gold.
What the research tells us…
While gold and silver are highly correlated in terms of price movement, however, the magnitude of relative price movements appears to differ a great deal based on whether gold is "undervalued" relative to silver (i.e., if the Gold/Silver Ratio is below 80) or "overvalued" relative to silver (i.e., if the Gold/Silver Ratio is above 80). While Strategy #1 highlighted above is not necessarily recommended as a standalone trading strategy (due to its high volatility and the fact that both metals can simultaneously experience significant price declines), there does appear to be a long-term edge that traders can exploit.